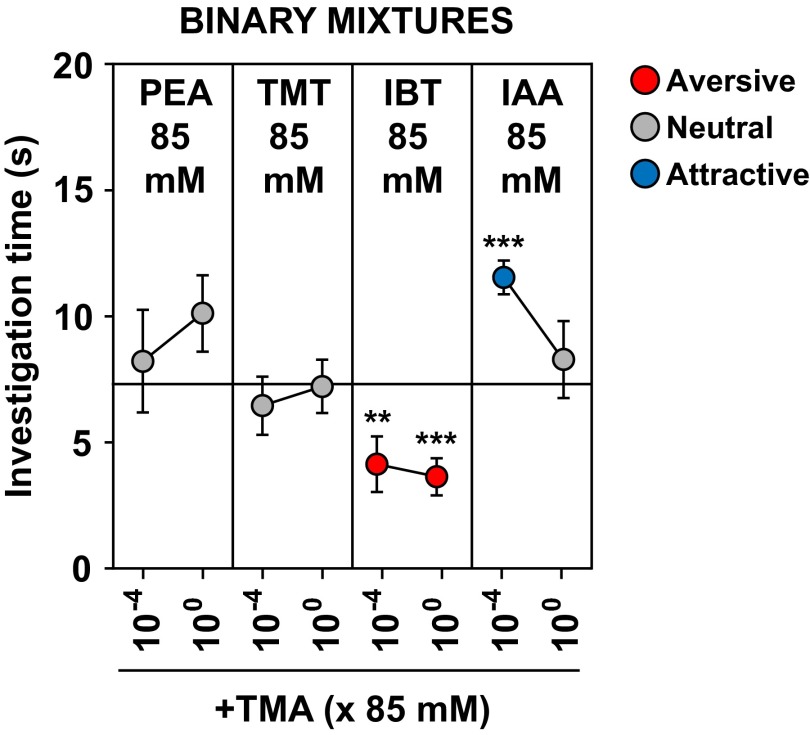
Fig. S9.
Effects of odorant concentration on responses to odorant mixtures. The olfactory preference test (see legend to Fig. 1) was used to test whether lowering the concentration of TMA would affect its ability to block aversion to other odorants. Responses obtained using 85 mM each odorant (Fig. 3A) are compared here with responses obtained using 85 mM each aversive odorant, but a 104-fold lower concentration of TMA. Circles indicate mean investigation time and error bars show SEM (n = 5–11 animals/odorant or water). Circles are colored to indicate aversion (red), attraction (blue), or a neutral response (gray) compared with water exposure. Asterisks indicate responses significantly different from water (unpaired t test, two-tailed): **P < 0.01; ***P < 0.001. Lowering the concentration of TMA 10,00-fold did not alter its effect on aversion to PEA, TMT, IBT, or IAA.

