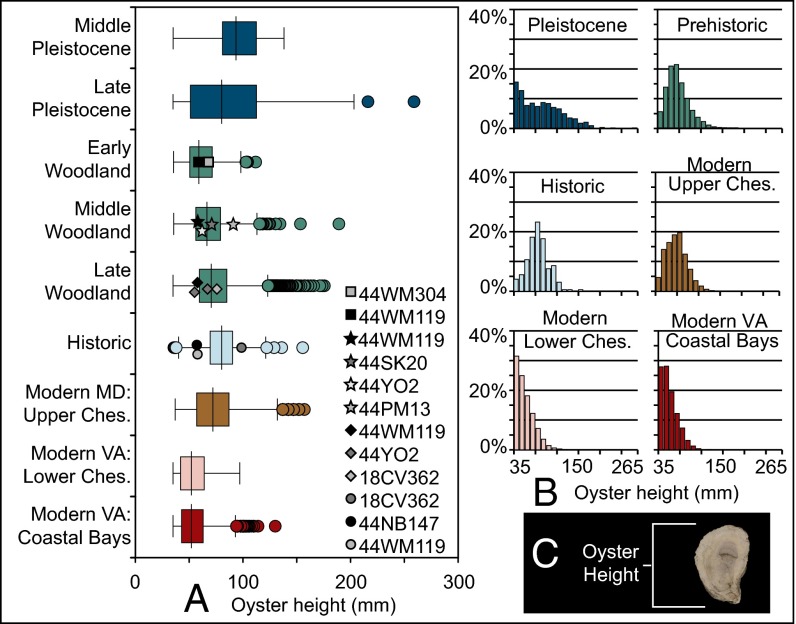
Fig. 1.
Comparison of Chesapeake Bay oyster height measurements through time for fossil, archaeological, and modern assemblages. (A) The box-and-whisker plots used in this study display data according to the following guidelines: The tall central line represents the median of the data; the box represents data between the first and third quartiles; whiskers represent data within 1.5× the interquartile range of the median; and circles represent data within 3× the interquartile range of the median. Archaeological site trinomials are listed on the right (SI Appendix, Table S2). (B) Frequency distribution of oyster size classes by time period. (C) Oyster shell showing location of the height measurement.

