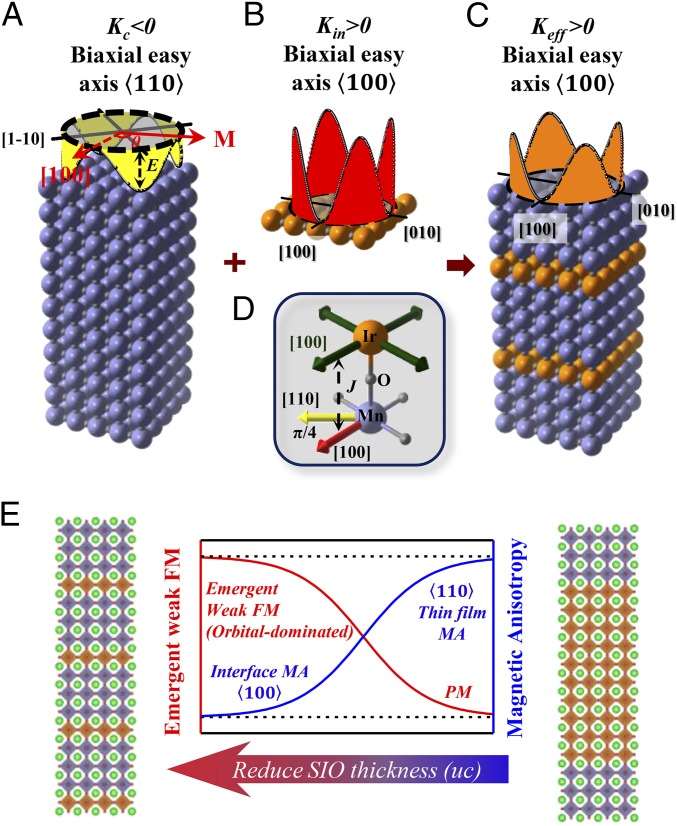
Fig. 4.
Schematic diagram of the origin of the MA engineering. (A) MA energy of LSMO. The anisotropy energy is defined by the formula , where M is the in-plane magnetization and is the angle to [100] (red arrows). The MCA of LSMO (Kc <0) favors the easy axis as shown by the black solid lines (energy minimum). (B) SIO-induced MA energy (Kin >0), which favors the easy axis. (C) Effective MA energy of SL31, in which the Kin overcomes Kc. Therefore, SL31 shows π/4 shift of the easy axis compared with LSMO. (D) Schematic diagram of the anisotropy contributions. The SIO-induced anisotropy is determined by the interfacial exchange coupling to the emergent weak ferromagnetism in SIO (green arrows), which effectively shifts the magnetic easy axis of LSMO by π/4. (E) Thickness evolution of the MA of the superlattice and the emergent magnetism in the strong SOC SIO (FM, ferromagnetic; PM, paramagnetic).

