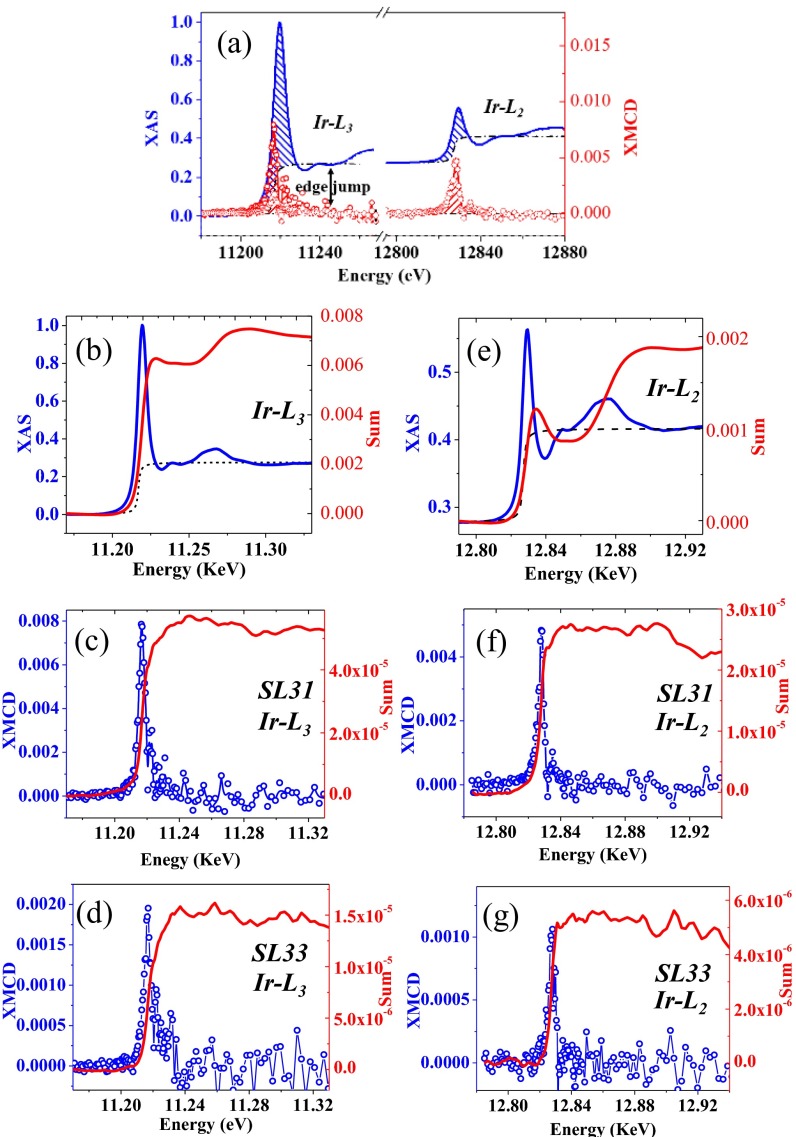
Fig. S6.
(A) Schematic diagram of the application of sum-rules to the Ir-edge XAS and XMCD. (B–D) Results on Ir L3 edge: integration (“sum” in each figure) of (B) XAS, (C) XMCD for SL31, and (D) XMCD for SL33. (E–G) Results on Ir L2 edge: integration of (E) XAS, (F) XMCD for SL31, and (G) XMCD for SL33.

