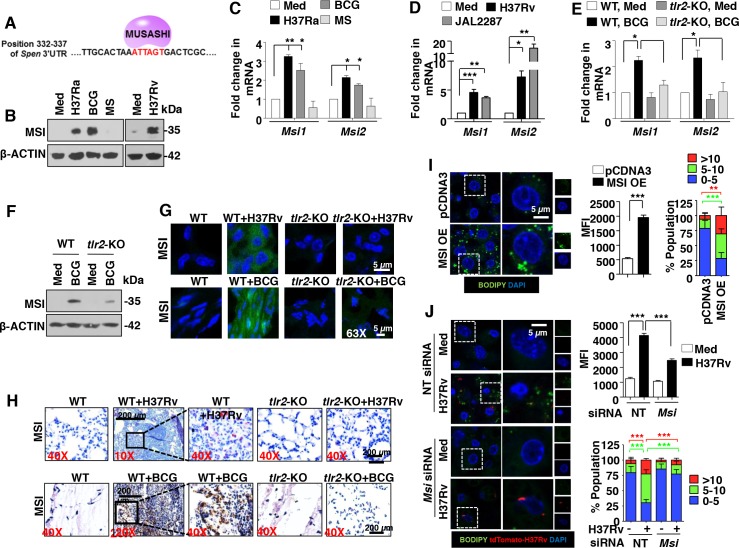
Fig 5. Mycobacteria-induced expression of MSI is requisite for FM formation.
(A) MSI-binding site, ATTAGT spanning the 332–337 residues of the Spen 3’UTR. (B-D) Mouse peritoneal macrophages were infected with the indicated bacteria for 6 h. Immunoblot analysis MSI (B) and quantitative real-time RT-PCR for Msi isoforms expression (C and D). (E and F) Transcript (E) and protein (F) levels of MSI in 6 h BCG-infected peritoneal macrophages from WT or tlr2-KO mice. (G and H) In vivo expression of MSI in the H37Rv-infected lung sections (upper panels) and BCG-induced granulomas (lower panels) by IF (G) and IHC (H) studies. (I and J) RAW 264.7 cells were transiently transfected with MSI1 OE (I) or peritoneal macrophages transfected with NT or Msi siRNA were infected with H37Rv expressing the red fluorescent protein tdTomato for 48 h. Representative IF images of macrophages with BODIPY-stained lipid droplets (left panels). Based on the IF images, MFIs were calculated (n = 100, each treatment) and plotted (middle panels). Frequency of FMs was calculated by counting the population of cells expressing 0–5, 5–10 or >10 lipid bodies (n = 250–300) and plotted as a bar graph (right panels). All data represents the mean ± SEM for at least 3 independent experiments, *P < 0.05, **P < 0.005, ***P < 0.0005 (one-way ANOVA followed by Tukey’s multiple-comparisons test except for two-tailed paired Student’s t-test in I) and all blots are representative of 3 independent experiments. Med, medium; WT, wild-type; KO, knockout; OE, overexpression; NT, non-targeting; MFI, mean fluorescence intensity. Original magnifications and scale for G and H are indicated on the images. Original magnifications 63X and Bar, 5 μm in I and J.

