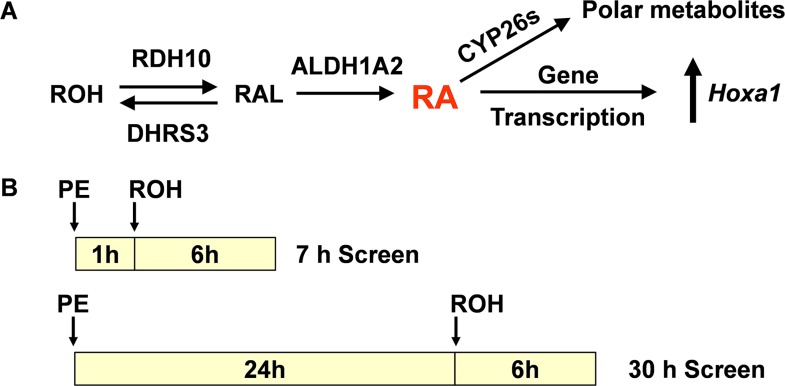
Fig 1.
(A) Major steps in the retinol signaling pathway of vertebrates. (B) Timeline for PE and ROH additions and duration of exposures for the 7 h and 30 h screens. The initial PE concentration was 50 μM. After the addition of ROH, the PE and ROH concentrations were 45 μM and 0.3 μM respectively. The initial and final DMSO concentration was 0.5%. P19 cells were cultured in 96-well plates as described previously [11].

