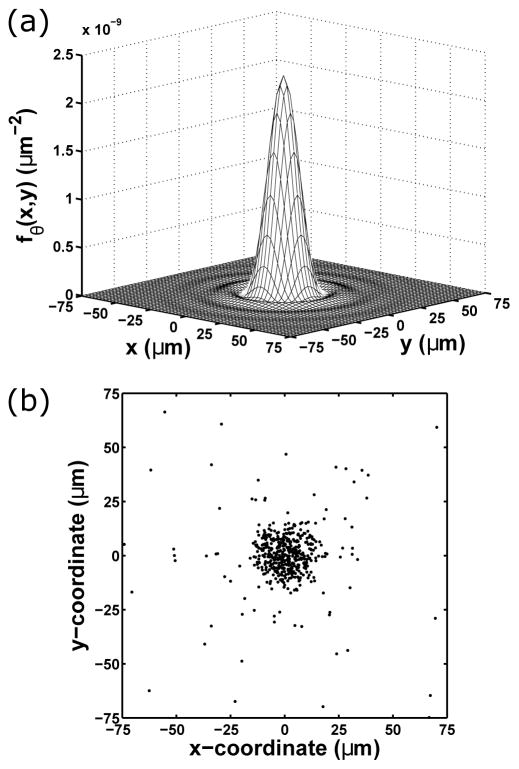
Fig. 1.
Fundamental data model example. (a) The photon distribution profile fθ for an in-focus and stationary molecule whose image is modeled with the Airy pattern. This profile assumes that the molecule is located at (x0, y0) = (0 nm, 0 nm) in the object space, and that photons of wavelength λ = 520 nm are collected using an objective lens with a numerical aperture of na = 1.4 and a magnification of M = 100. While the profile is defined over the detector plane ℝ2, the plot shows its values over the 150 μm × 150 μm region over which it is centered. (b) A fundamental image simulated according to the profile in (a), with each dot representing the location at which a photon is detected. The simulation assumes a constant photon detection rate of Λ0 = 10000 photons/s and an acquisition time of t − t0 = 0.05 s, such that the mean photon count in an image is Λ0 · (t − t0) = 500. In this particular realization, N0 = 516 photons are detected, of which 492 fall within the 150 μm × 150 μm region shown, over which the image is centered.

