
Figure 7.
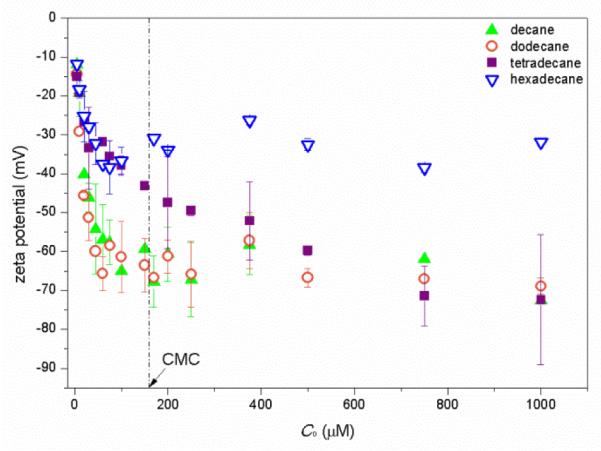
Zeta potential of aggregates versus the monoRL total concentration (C0) for the n-alkanes solubilization. Error bars show mean ± standard deviation.
Official websites use .gov
A
.gov website belongs to an official
government organization in the United States.
Secure .gov websites use HTTPS
A lock (
) or https:// means you've safely
connected to the .gov website. Share sensitive
information only on official, secure websites.
Zeta potential of aggregates versus the monoRL total concentration (C0) for the n-alkanes solubilization. Error bars show mean ± standard deviation.