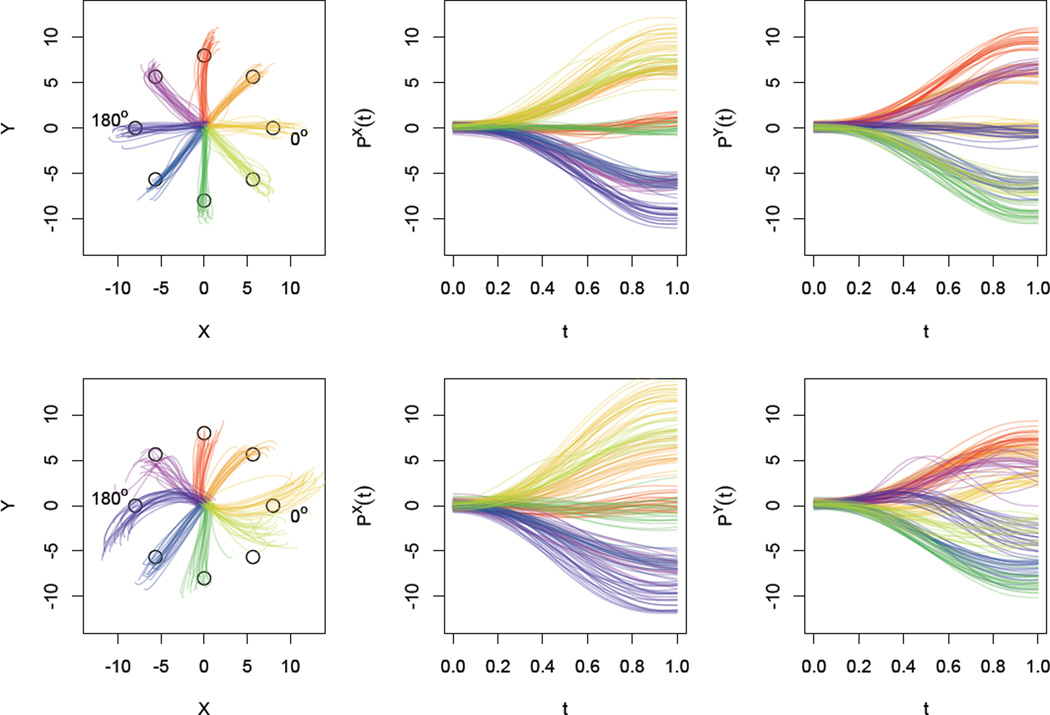
Figure 1.
Observed data for two subjects; the top row shows the dominant hand of a healthy control, and the bottom row shows the affected dominant hand of a severe stroke patient. The left column shows observed kinematic data for all reaches observed in the dominant hand. The middle and right columns show the X- and Y- position separately for all reaches.

