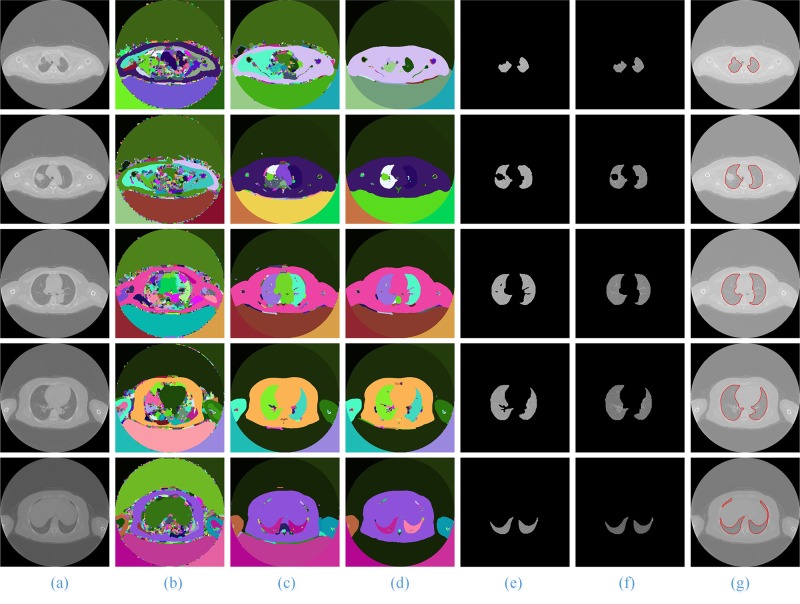
Fig 8. The segmentation results of using the watershed method.
Column (a) is the five original lung CT images from top to bottom; (b)-(d) show the results of the level values of 0.05, 0.1 and 0.15, respectively; and (e) and (f) present the final results using the watershed algorithm and manual segmentation.

