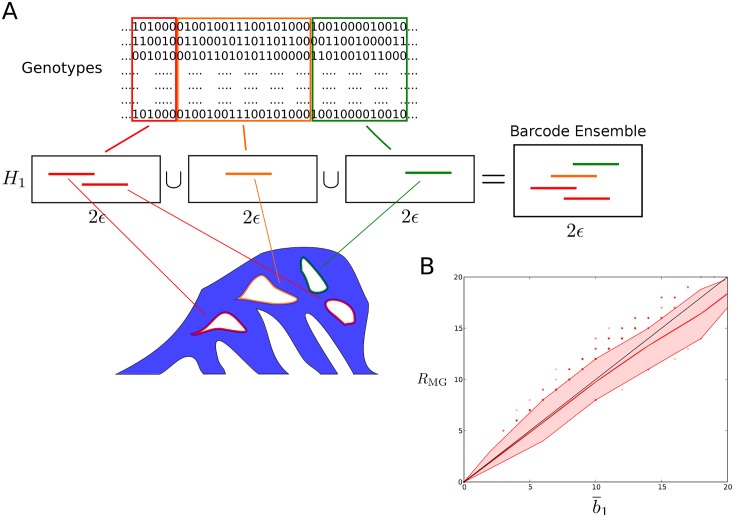
Fig 6. Barcode ensemble of a sample.
(A) Schematic representation of the barcode ensemble of a genomic sample. Persistent homology is computed for each genomic interval of a partition of the sequence. Barcodes associated to different genomic intervals capture different recombination events. The union of all barcodes is the barcode ensemble. The total number of intervals in the barcode ensemble is denoted as . The partition is chosen such that is maximized. (B) Comparison between lower bounds and RMG ≤ Rmin in coalescent simulations. Values of and RMG for simulated samples of 40 sequences with 12 segregating sites, sampled from a population under the coalescent model with recombination. 4,000 samples were simulated in total. The colored band represents the interdecile range, whereas the central line represents the mean. The values of and RMG are strongly correlated (Pearson’s r = 0.98, p < 10−100). At very high recombination rates, tends to be larger than RMG, as cases where occur more frequently.

