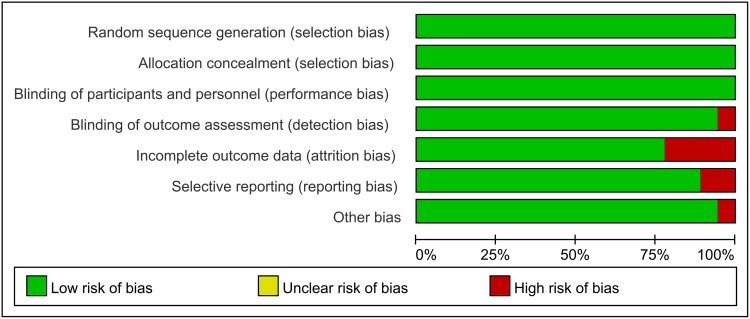
Fig 2. Quality evaluation of RCTs using RevMan software.
In each dimension, the area of different colors represents the proportion of different publication biases derived from the included literatures. When no clear answer could be obtained for a dimension, it was classified as presenting a high risk of bias.

