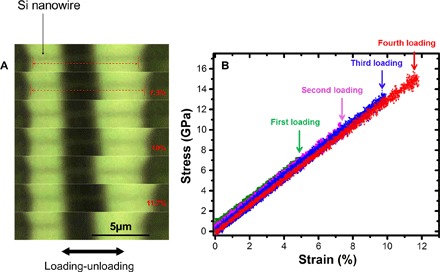
Fig. 3. Tensile test in ambient environment under an optical microscope.

(A) Loading-unloading tensile test of a Si nanowire with increasing tensile strain amplitude and full unloading in each cycle. Again, the nanowire recovered its original length after strain values of ~5, ~7.3, and ~10% were experienced in each cycle and eventually fractured at the fourth cycle with strain value of ~11.7% (top to bottom: the last three cycles), where most of the broken nanowire flew away, as shown in the last frame. Note that the contrast in the optical images was slightly enhanced for clarity. (B) Corresponding stress-versus-strain curves of the multicycle loading–fully unloading test, using different colors to better illustrate the data from each cycle.
