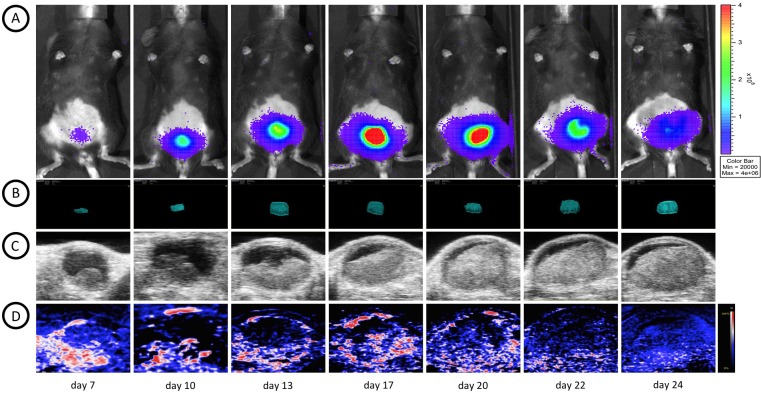
Fig 3. Longitudinal multimodal assessment of bladder tumor growth.
All multimodal images were taken at the same days for optimal comparison. (A) bladder tumor growth visualized by serial BLI images of a representative mouse taken 18 minutes after s.c. luciferin injection. An increase in tumor volume can be observed in serial 3D HRUS (B) images and longitudinal 2D sections (C). During the time course of tumor growth a decrease in oxygen saturation (D) from early-stage tumor to later stage tumors was observed.

