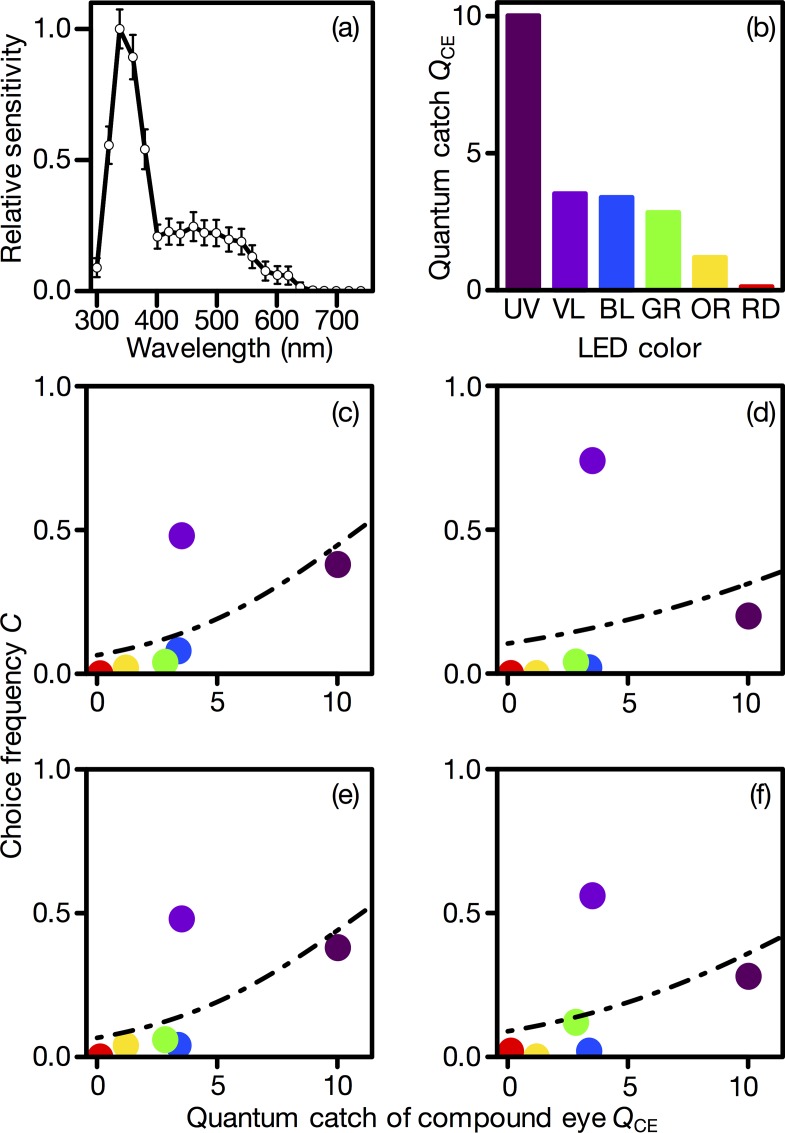
Fig 3. Compound-eye-based modeling of wavelength preference.
(a) Spectral sensitivity of the Exorista japonica compound eye. Mean ± standard error. (b) The relative quantum catch of the compound eye. (c-f) The compound eye quantum catch versus the choice frequency for LEDs in (a) unmated males, (b) mated males, (c) unmated females, and (d) mated females. Circles indicate the measured choice frequency, and the dashed line is the value fitted by the model (Eq 2) as a function of QCE. The coefficients are shown in Table 1.

