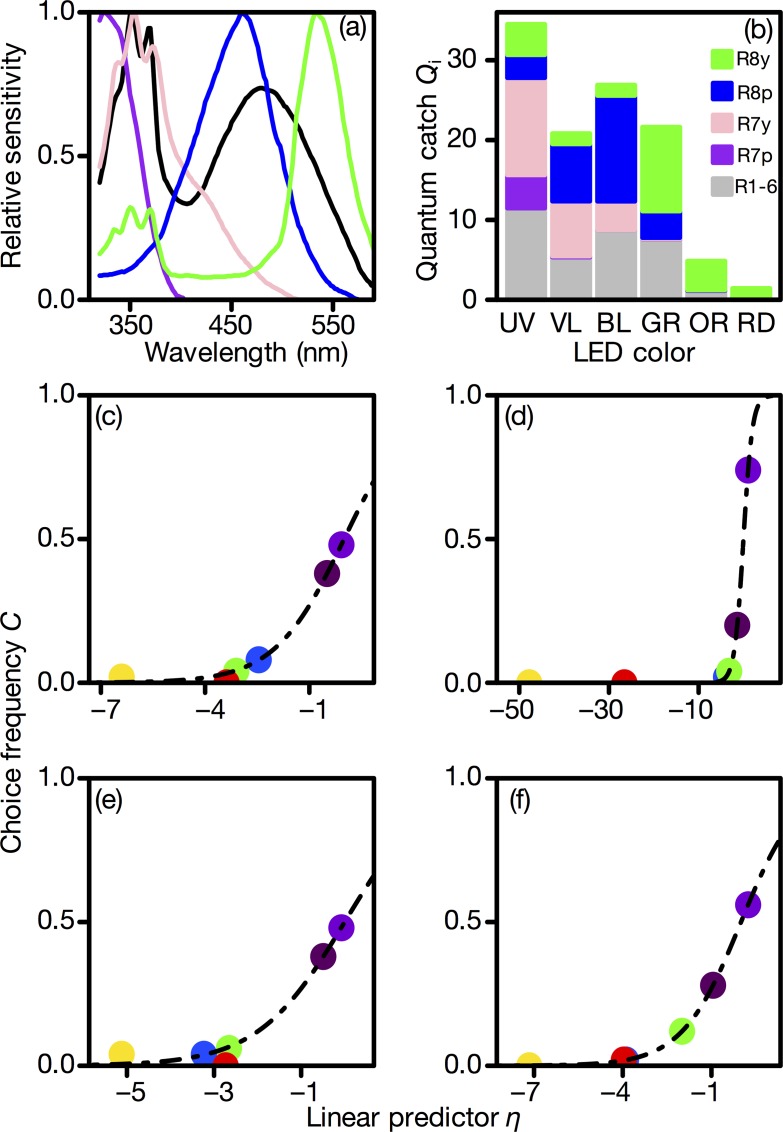
Fig 4. Photoreceptor-based modeling of wavelength preference.
(a) Spectral sensitivities of the Musca domestica photoreceptors ([11]; the numerical data were obtained from [28]). (b) The relative quantum catch of individual photoreceptors, Qi. (c-f) Linear predictor in the best photoreceptor-based model versus choice frequency in (c) unmated males, (d) mated males, (e) unmated females, and (f) mated females. Circles indicate the measured choice frequency, and the dashed line is the value fitted by the best model as a function of the linear predictor η. The coefficients are shown in Tables 2–5.

