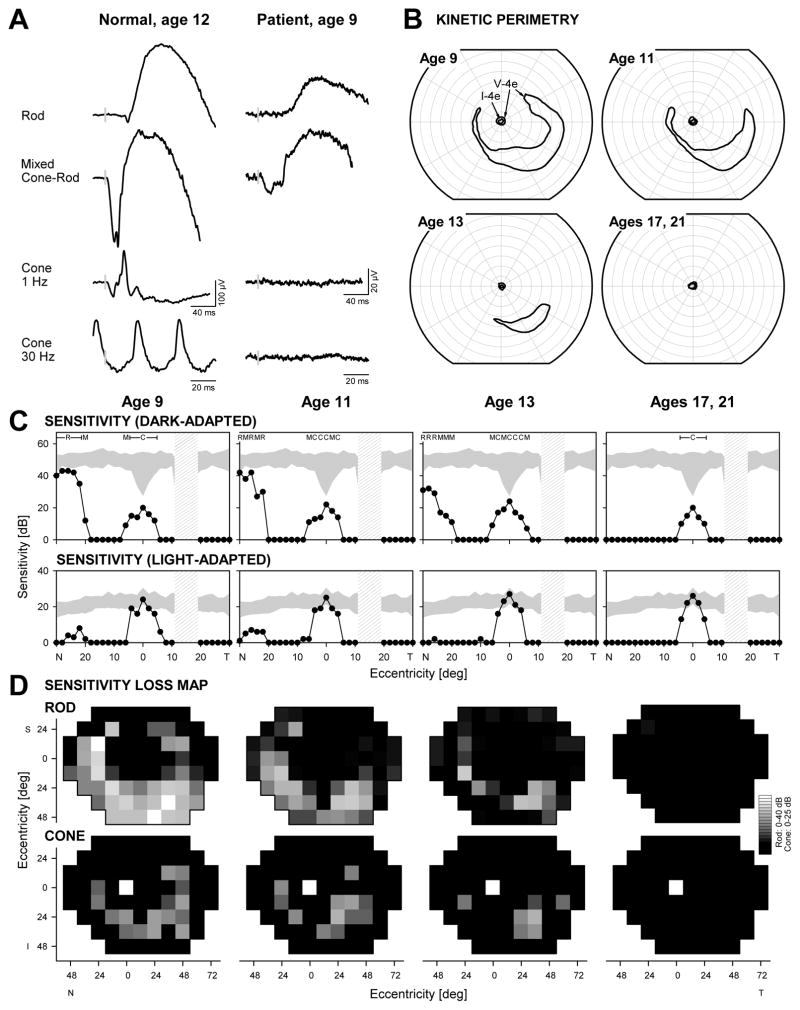
FIGURE 1.
Visual function in a patient with SPATA7 mutations. (A) Representative ERG waveforms from a normal subject (left) compared with those from the patient with SPATA7 mutations at the initial visit. Vertical gray bars on the traces mark stimulus onset; calibration bars are at right and below the waveforms. (B) Serial kinetic visual fields over a 12-year follow-up period (right eye data shown). (C) Dark-adapted (500 nm, top) and light-adapted (600 nm, bottom) horizontal sensitivity profiles (filled symbols) compared with normal data (shaded band, mean ± 2SD). For dark-adapted sensitivities, photoreceptor mediation based on two-color (500 nm, 650 nm) testing is shown above the results: R, rod-mediated; M, mixed rod- and cone-mediated; C, cone-mediated. Hatched bar: physiologic blind spot. (D) Serial maps of rod (500 nm dark-adapted, top) and cone (600 nm light-adapted, bottom) sensitivity losses across the visual field in the patient. Gray scale is shown to the right. N, nasal; T, temporal; I, inferior; S, superior visual field.

