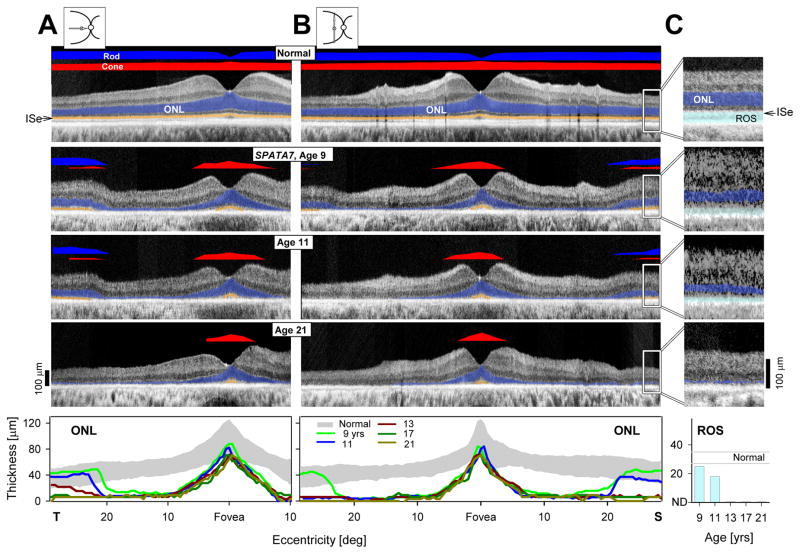
FIGURE 2.
Serial changes in retinal structure in the patient with SPATA7 mutations. (A,B) Serial OCT cross-sections along the horizontal (A) and vertical (B) meridians through the fovea from representative visits are compared with data from a normal subject. Icons to the left of the normal cross-sections show scan location on fundus schematic. Bars above the cross-sections indicate rod (blue bar; dark-adapted, 500-nm stimuli) and cone (red bar; light-adapted, 600-nm stimuli) sensitivity measured by chromatic static perimetry. Outer nuclear layer (blue) and outer segments (orange) are highlighted on the scans. Serial ONL thickness as a function of eccentricity (shaded band, normal mean ± 2SD), is shown below. T, temporal; S, superior retina. (C) Magnified OCT images from extrafoveal regions (20–30° superior retina) delineated by white rectangles on the images illustrate serial changes in retina. Rod outer segments (cyan) are highlighted. Serial rod outer segment thickness quantitation is shown below (C).

