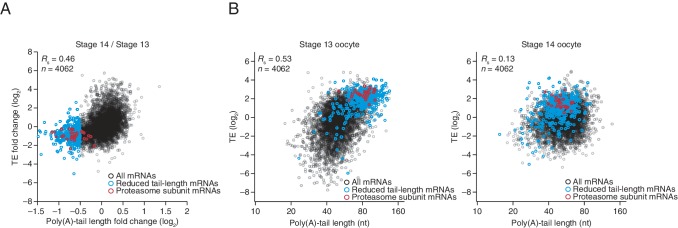
Figure 2. Coupling between poly(A)-tail length and translational efficiency in oocytes.
Relationship between mean poly(A)-tail length and TE in either oocytes at the indicated stage or activated eggs (top), and the relationship between tail-length and TE changes observed between adjacent stages (bottom). TE values (log2) were median centered (median values in stage 11, 12, 13, and 14 oocytes and activated eggs were –0.6641, –0.9006, –1.38, –0.2523, and –0.0158, respectively). TE fold-change values (log2) were median centered for each comparison (median values, –0.1961, –0.3969, 1.0886, and 0.2123 from left to right). The TE data for stage 14 oocytes and activated eggs were from Kronja et al. (2014b), and the plot of mean poly(A)-tail length and TE for the stage 14 oocyte is redrawn from Figure 1B. Otherwise, these panels are as in Figure 1B.


