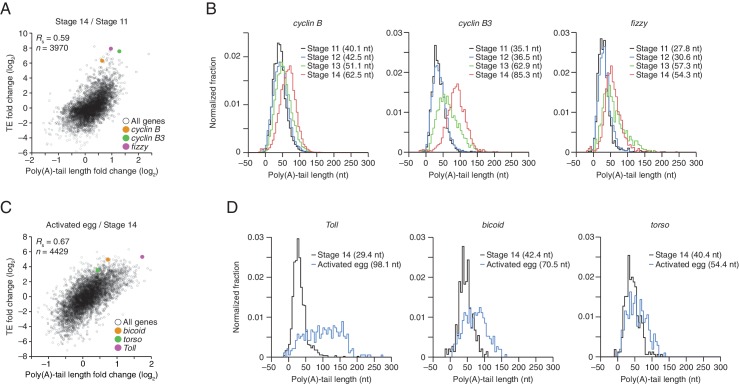
Figure 4. TEs and Poly(A) tail lengths of selected mRNAs during oocyte maturation and egg activation.
(A) Relationship between net tail-length and TE changes observed after oocyte maturation, highlighting the behavior of cyclin B, cyclin B3, and fizzy. The TE data for stage 14 oocytes were from Kronja et al. (2014b). Values from stage 14 oocytes are compared to those of stage 11 oocytes (median TE value used for median centering, 0.389); otherwise, as in Figure 1B. (B) Distributions of poly(A)-tail lengths of mRNAs from cyclin B (left), cyclin B3 (middle), and fizzy (right) at the indicated developmental stages. Mean poly(A)-tail lengths are in parentheses. (C) Relationship between tail-length and TE changes observed after egg activation, showing the same plot as in Figure 2 (bottom right), but highlighting the behavior of Toll, bicoid, and torso. (D) Distributions of poly(A)-tail lengths of mRNAs from Toll (left), bicoid (middle), and torso (right) at the indicated developmental stages; otherwise, as in Figure 4B.

