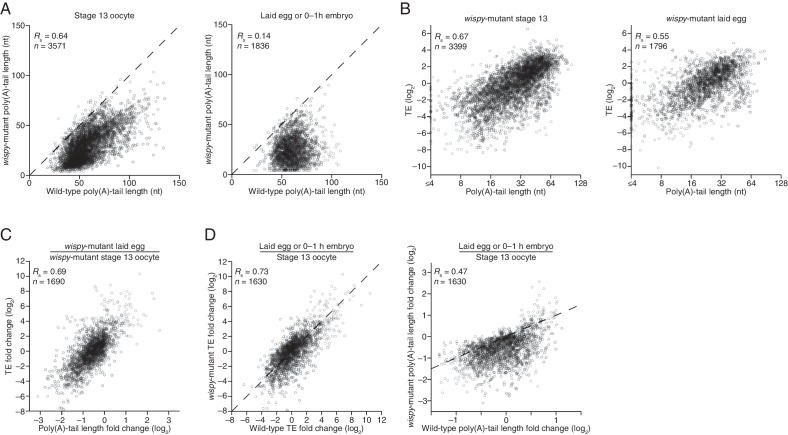
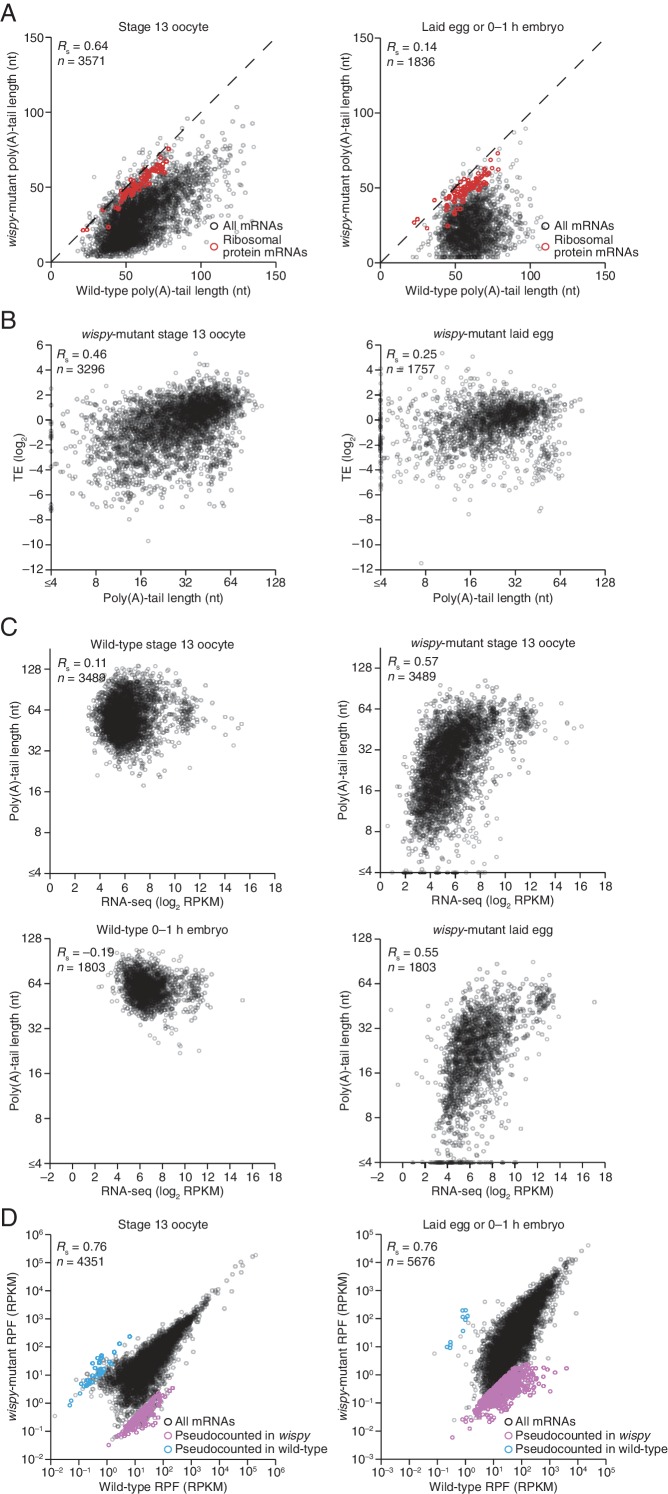
Figure 5. Widespread impact of Wispy on poly(A)-tail length but not TE.
(A) Comparison of mean poly(A)-tail lengths in wild-type and wispy-mutant stage 13 oocytes (left) and in wild-type cleavage-stage embryos and wispy-mutant laid eggs (right). Plotted are mean poly(A)-tail lengths of mRNAs with ≥100 poly(A) tags in both the wild-type and wispy-mutant sample at the indicated developmental stage. mRNAs that had mean tail-length values ≤4 nt are reported as 4 nt. The dashed line is for y = x. (B) Relationship between mean poly(A)-tail length and TE at the indicated developmental stage in wispy-mutant oocytes (left) and laid eggs (right). The TEs were calculated by dividing wispy-mutant stage 13 oocyte or laid egg RPF data by wild-type stage 13 oocyte or 0–1 hr embryo RNA-seq data, respectively. TE values (log2) were median centered (median values in wispy-mutant stage 13 oocytes and laid eggs, –1.0551 and 0.3302, respectively). mRNAs that had mean tail-length values ≤4 nt are reported as ≤4 nt; otherwise, as in Figure 1B. (C) Relationship between tail-length and TE changes observed between wispy-mutant laid eggs and stage 13 oocytes. TE fold-change values (log2) were median centered (median value, 0.8132); otherwise, as in Figure 1B. The mRNAs that seemed to have increased poly(A)-tail lengths over this time tended to have very short poly(A)-tails in stage 13 oocytes, suggesting that their positive fold-change values reflected difficulties in accurately measuring poly(A)-tails <8 nt using PAL-seq rather than genuine increases in poly(A)-tail length. (D) Comparison of TE changes for wild-type and wispy-mutant samples during the OET (left) and comparison of tail-length changes for wild-type and wispy-mutant samples during the OET (right). TE fold-change values (log2) were median centered (median values for the wild-type and wispy-mutant samples, 0.7207 and 0.8367, respectively). Dashed line is for y = x. Otherwise, this panel is as in Figure 1B.


