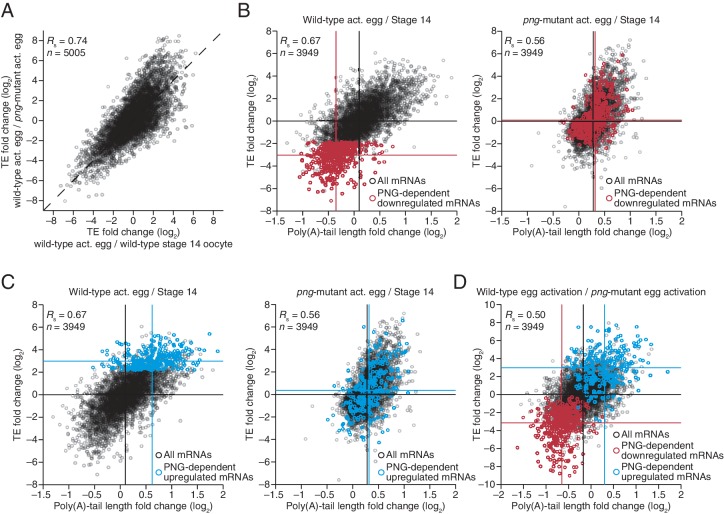
Figure 6. Widespread translational regulation by PAN GU primarily attributable to changes in poly(A)-tail length.
(A) Relationship between the TE changes in wild-type activated eggs relative to wild-type stage 14 oocytes and those in wild-type activated eggs relative to png-mutant activated eggs. TE fold-change values (log2) were median centered (median values for wild-type activated egg relative to stage 14 oocyte and for wild-type activated egg relative to png-mutant activated egg, 0.3065 and 0.0881, respectively). Results are plotted for all mRNAs that had ≥10.0 RPM in the RNA-seq data of all samples, and ≥10.0 RPM in the ribosome profiling data of at least one of the two samples being compared and >0.0 RPM in the other. mRNAs ≥4-fold up- or downregulated in both comparisons were defined as the PNG-dependent up- or downregulated mRNAs, respectively. The TE data for wild-type stage 14 oocytes and activated eggs and png-mutant activated eggs were from Kronja et al. (2014b). Dashed line is for y = x. (B) Relationship between mean tail-length changes and TE changes after egg activation for wild-type activated eggs (left; modified from Figure 2 to include only the mRNAs that also passed the cutoffs for the png-mutant comparison) and png-mutant activated eggs (right). The mRNAs with PNG-dependent downregulation are highlighted in red (Supplementary file 3), analyzing and highlighting the same mRNAs in both plots. TE fold-change values (log2) were median centered (median for wild-type and png-mutant samples, 0.1366 and 0.6448, respectively. Black lines indicate median values for all mRNAs, and red lines indicate median values for the PNG-dependent downregulated mRNAs. The TE data for wild-type stage 14 oocytes and activated eggs and png-mutant activated eggs are from Kronja et al. (2014b). Otherwise, this panel is as in Figure 1B. (C) The plots of panel B, highlighting the PNG-dependent upregulated mRNAs in blue (Supplementary file 3). (D) Relationship between tail-length and TE changes during egg activation in wild-type relative to the png-mutant samples, analyzing and highlighting the same mRNAs as in panels B and C. TE fold-change values (log2) were median centered (median value, –0.727). Otherwise, this panel is as in Figure 6B.


