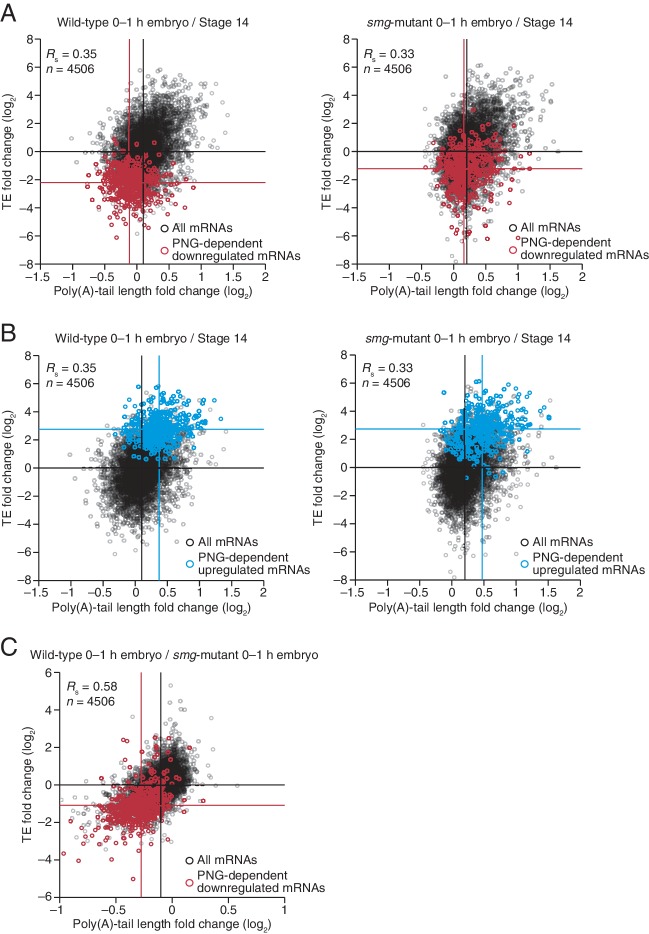
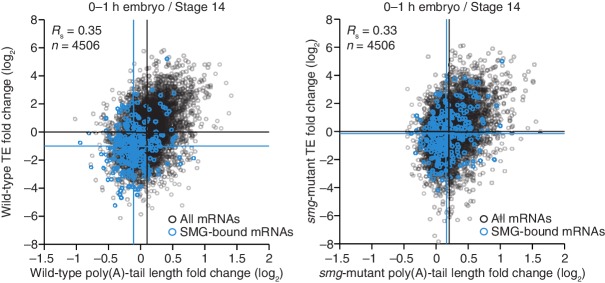
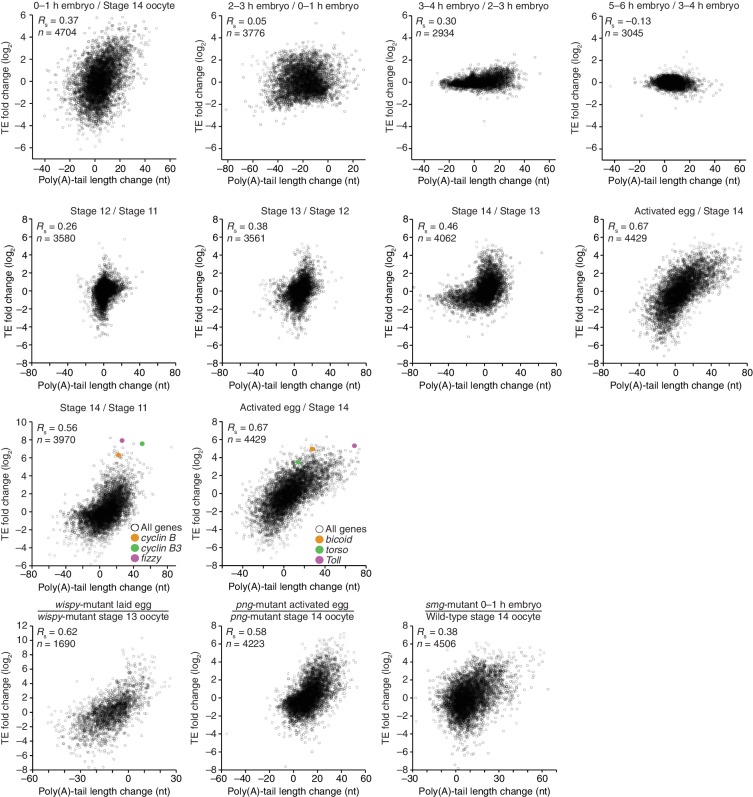
Figure 7. Translational regulation by Smaug primarily explained by changes in poly(A)-tail length.
(A) Relationship between mean tail-length changes and TE changes during the OET for wild-type 0–1 hr embryos (left) and smg-mutant 0–1 hr embryos (right), comparing wild-type or smg-mutant 0–1 hr embryos to wild-type stage 14 oocytes. The wild-type plot is redrawn from Figure 1B, but includes only the mRNAs that also passed the cutoffs for the smg-mutant comparison. TE fold-change values (log2) were median centered (median for the wild-type and smg-mutant samples, 0.175 and –0.0221, respectively). The PNG-dependent downregulated mRNAs are in red (Supplementary file 3), analyzing and highlighting the same mRNAs in both plots. Otherwise, this panel is as in Figure 6B. (B) The plots of panel A, highlighting the PNG-dependent upregulated mRNAs in blue (Supplementary file 3). (C) Relationship between tail-length and TE changes for wild-type 0–1 hr embryos relative to smg-mutant 0–1 hr embryos, analyzing and highlighting the same mRNAs as in panel A. TE fold-change values (log2) were median centered (median value, 0.2634). Otherwise, this panel is as in Figure 6D.


