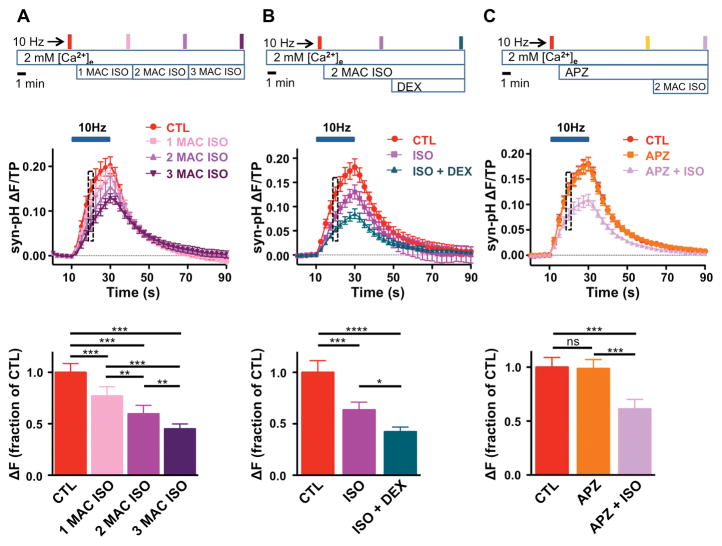
Figure 6. Dexmedetomidine potentiates isoflurane inhibition of action potential-evoked synaptic vesicle exocytosis.
A, Top, Schematic diagram of protocol. Filled boxes indicate 20 s of 10 Hz electrical stimulation with sequential exposure to 1 minimum alveolar concentration (MAC, 0.35 mM), 2 MAC or 3 MAC isoflurane (ISO) for 5 min. Middle, Time series of synaptophysin-pHluorin (syn-pH) fluorescence changes, shown every 2.5 s, normalized to total pool (TP) before and after 20 s stimulation at 10 Hz. Bottom, Mean effect of ISO on synaptic vesicle (SV) exocytosis at 10 s of stimulation (box) normalized to control (n = 5). B, Effects of 0.1 μM dexmedetomidine (DEX) in the presence of 2 MAC ISO on action potential (AP)-evoked SV exocytosis at 20 s of 10 Hz stimulation. Top, Schematic diagram of protocol. Middle, Time series of syn-pH fluorescence changes, shown every 2.5 s, normalized to TP before and after 20 s stimulation at 10 Hz. Bottom, Mean effect of ISO and ISO + DEX on SV exocytosis at 10 s of stimulation (box) normalized to control (n = 7). C, Effects of the nonselective α2-adrenergic receptor (AR) antagonist atipamezole (APZ; 1 μM) on 2 MAC ISO inhibition of AP-evoked SV exocytosis at 10 s of 10 Hz stimulation. Top, Schematic diagram of protocol. Middle, Time series of fluorescence changes, shown every 2.5 s, normalized to TP before and after 20 s stimulation at 10 Hz. Bottom, Mean effect of APZ and APZ + ISO on SV exocytosis at 10 s of stimulation (box) normalized to control (n = 7). Data are expressed as mean ± SEM. *p < 0.05, **p < 0.01, ***p < 0.001, ****p < 0.0001, ns, not significant by one-way repeated measures ANOVA followed by Tukey’s multiple comparison test.

