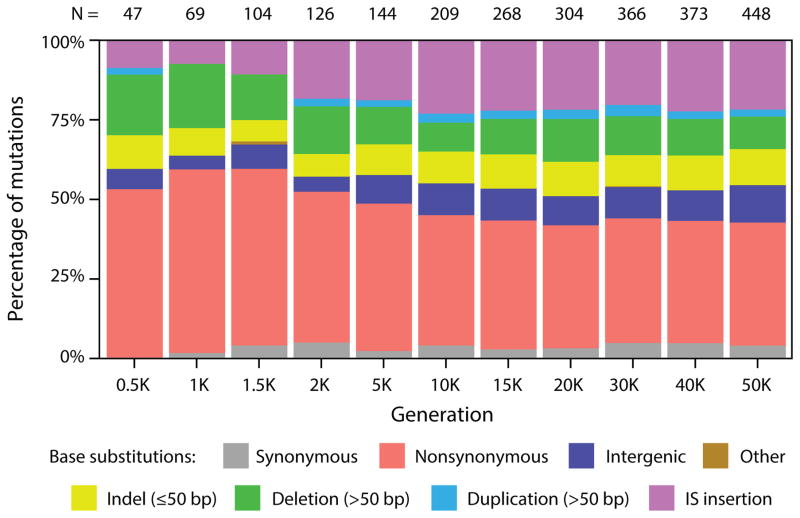
Extended Data Figure 7. Mutational spectrum for nonmutator lineages in the LTEE.
Shaded bars show the distribution of different types of genetic change for all independent mutations found in the set of nonmutator clones that were sequenced at each generation. The total number of mutations in this set at each time point (N) is shown above each column. Base substitutions are divided into synonymous, nonsynonymous, intergenic, and other categories; the nonsynonymous category includes nonsense mutations, and the “other” category includes rare point mutations in noncoding RNA genes and pseudogenes.

