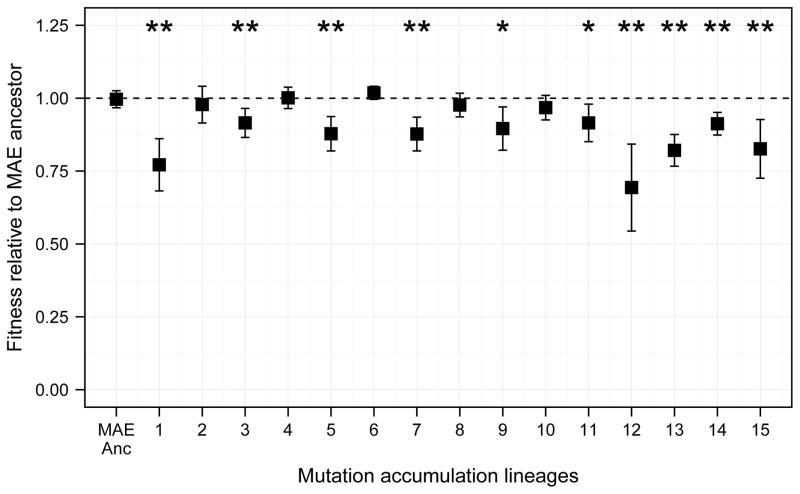
Extended Data Figure 8. Changes in fitness of MAE lines after 550 single-cell bottlenecks and ~13,750 generations.
Each point shows the mean fitness based on 9 competition assays between the MAE ancestor (REL1207) or one of the 15 MAE lineages (JEB807–JEB821) and the Ara− variant of the MAE ancestor (REL1206). One-day competition assays were performed using the standard procedures and same conditions as for the LTEE16,17. Error bars show 95% confidence intervals. Above each mean, one or two asterisks indicate p < 0.05 or p < 0.01, respectively, based on two-tailed t-tests of the null hypothesis that relative fitness equals 1. Ten of the 15 MAE lines experienced significant fitness declines, while none had significant gains.

