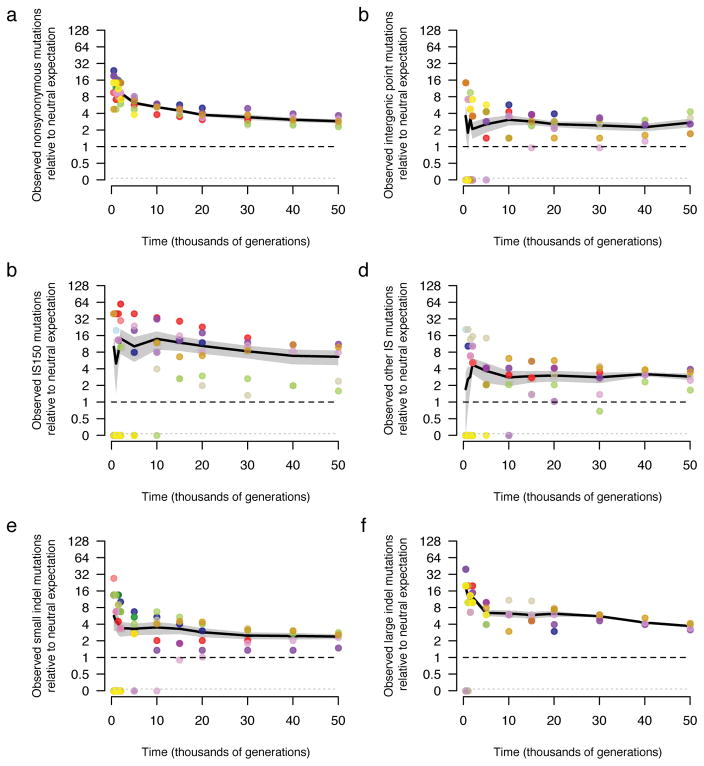
Extended Data Figure 9. Trajectories for mutations by class in the LTEE in comparison with neutral expectations based on the MAE.
Accumulation of a, nonsynonymous mutations, b, intergenic point mutations, c, IS150 insertions, d, all other IS-element insertions, e, small indels, and f, large indels. Colours are the same as in Fig. 1. All values are expressed relative to the rate at which synonymous mutations accumulated in nonmutator LTEE lineages over 50,000 generations (Fig. 5a), and then scaled by the ratio of the number of the indicated class of mutation relative to the number of synonymous mutations in the MAE lines. In all panels, each symbol shows a nonmutator or premutator population. Note the discontinuous scale, in which populations with no mutations of the indicated type are plotted below. Black lines connect grand means over the replicate LTEE populations; the grey shading shows the corresponding standard errors.

