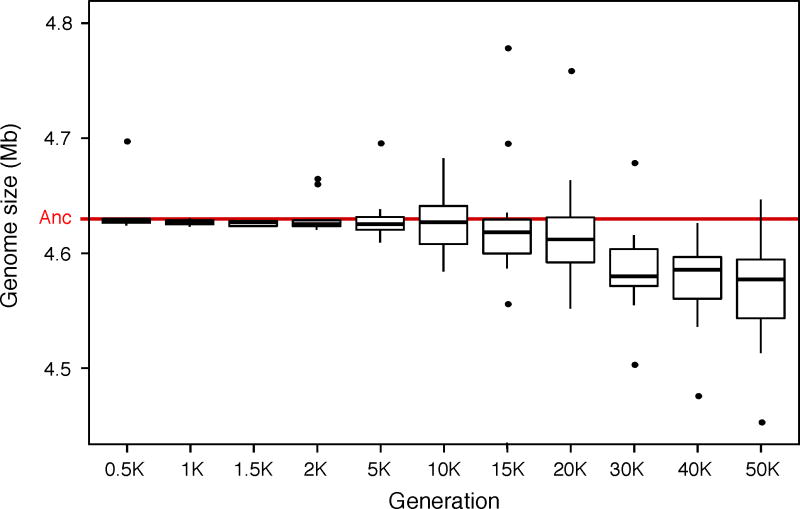
Extended Data Figure 1. Changes in genome size during the LTEE.
Box-and-whiskers plot showing the distribution of average genome length (Mb, million bp) for each of the 12 LTEE populations based on the two clones sequenced at each time point shown from 500 to 50,000 generations. The red line shows the length of the ancestral genome. The boxes are the interquartile range (IQR), which spans the second and third quartiles of the data (25th to 75th percentiles); the thick black lines are medians; the whiskers extend to the outermost values that are within 1.5 times the IQR; and the points show all outlier values beyond the whiskers.

