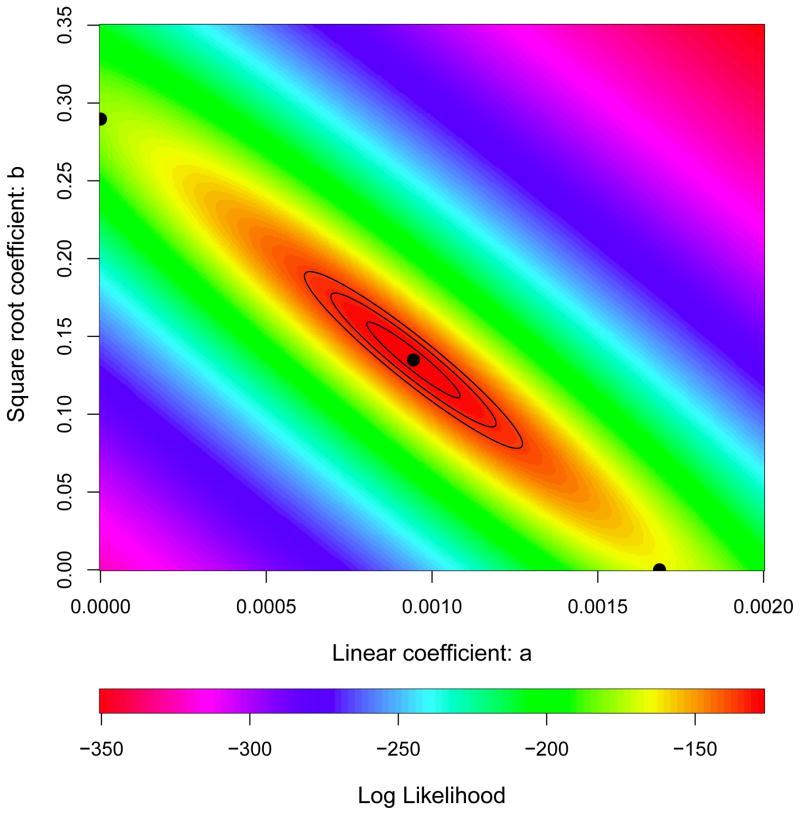
Extended Data Figure 4. Uncertainty in parameter estimation for model describing the rates of accumulation for neutral and beneficial mutations.
Contours show relative likelihoods for simultaneously estimating the linear and square-root coefficients from the observed numbers of mutations that accumulated over time in nonmutator and premutator lineages (Fig. 3). The black central point shows the maximum likelihood estimates, and the three black contours show solutions 2, 6, and 10 log units away. The points on the horizontal and vertical axes show values for the best one-parameter models.

