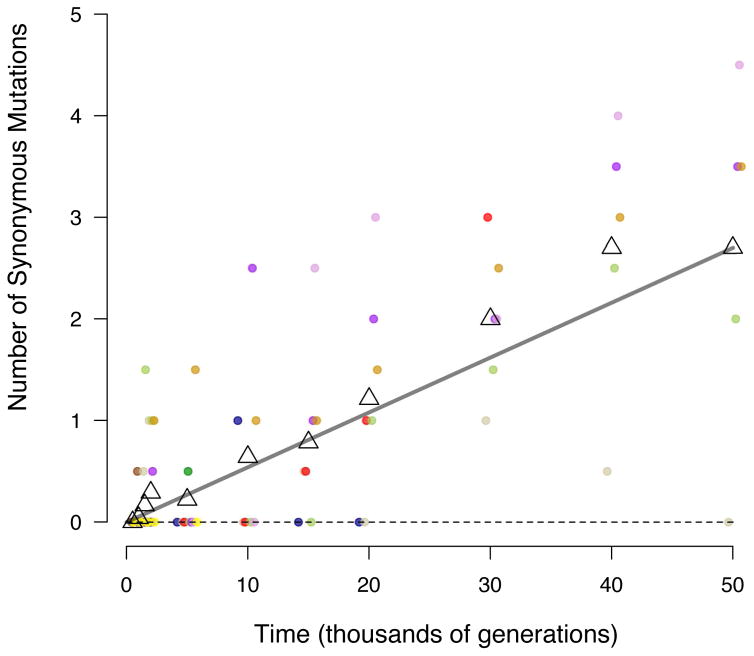
Extended Data Figure 5. Accumulation of synonymous substitutions in nonmutator lineages.
Each filled symbol shows the mean number of synonymous mutations in the (usually two) nonmutator genomes from an LTEE population that were sequenced at that time point; noninteger values can occur if the two genomes have different numbers. Small horizontal offsets were added so that overlapping points are visible. Colours are the same as in Fig. 1. Open triangles show the grand means of the replicate populations. The grey line extends from the intercept to the final grand mean. The slope of that line was used to scale the relative rates of synonymous, nonsynonymous, and intergenic point mutations in Fig. 5.

