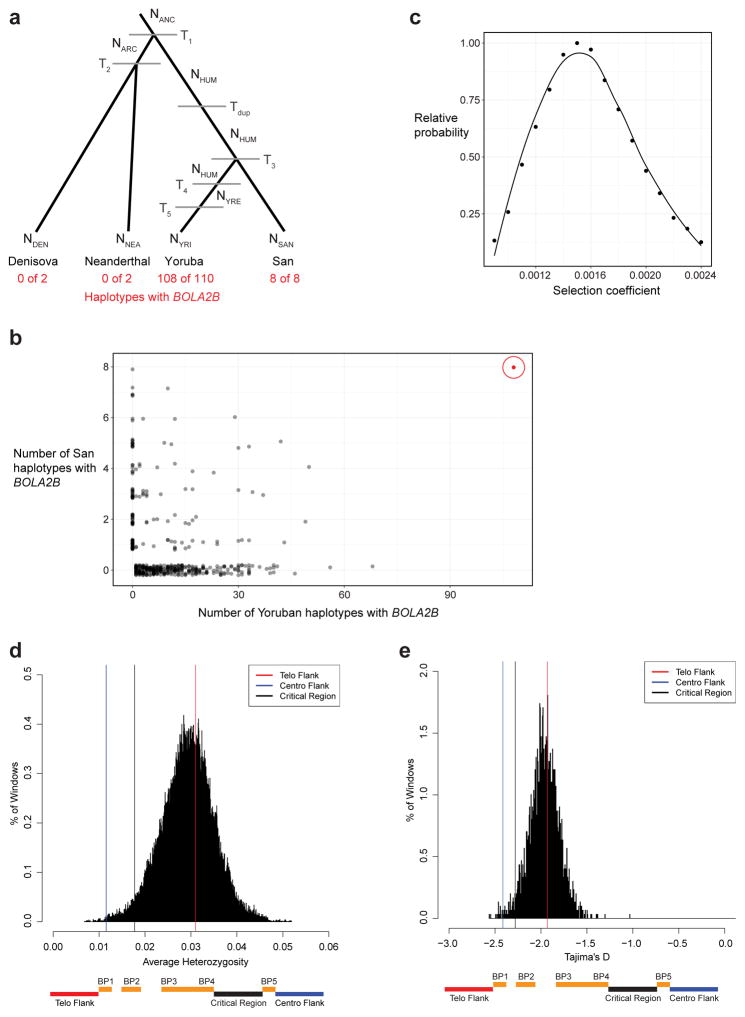
Extended Data Figure 8. Population genetic modeling of the BOLA2B duplication and critical region analyses.
a) Demographic model (adapted from ref. 16) used to simulate BOLA2B evolution under different scenarios. NANC, effective population size of Homo ancestor, 21,600. NARC, effective population size of Neanderthal-Denisova ancestor, 500. NHUM, effective population size of human ancestor, 24,000. NYRE, effective size of Yoruban population after expansion, 45,000. NDEN, effective population size of Denisova, 500. NNEA, effective population size of Neanderthal, 500. NYRI, effective size of extant Yoruban population, 10,000. NSAN, effective size of extant San population, 10,000. T1, time of archaic hominin divergence from modern humans, 650,000 years. T2, time of Neanderthal-Denisova divergence, 525,000 years. Tdup, time of formation of BOLA2B, 282,000 years. T3, time of Yoruban-San divergence, 200,000 years. T4, time of Yoruban population expansion, 157,500 years. T5, time of Yoruban population decline, 37,500 years. b) Simulation results (n = 1,000,000) assuming that the duplication that formed BOLA2B occurred once, 282 kya, along the modern human ancestral lineage and evolved under neutrality compared to the observed genotype frequencies of BOLA2B in 8 San and 110 Yoruban haplotypes. Nearly all (999,531) simulations resulted in BOLA2B being lost from both populations; results from the remaining 469 simulations (black) are shown alongside the observed data (red, circled). Under this simple neutral model incorporating BOLA2B age, the observed BOLA2B frequency is never approached. c) Simulation was repeated exploring a range of selection coefficients from 0.0009 to 0.0024 (increments of 0.0001), and the relative probability of the observed data under each scenario was calculated as the proportion of simulations yielding the observed BOLA2B genotypes among simulations where BOLA2B was not lost relative to the maximum such proportion for any single selection coefficient considered. The maximum likelihood estimate for the selection coefficient was s = 0.0015. Smoothed line is LOESS regression curve. d) Low average heterozygosity of the chromosome 16p11.2 BP4–BP5 critical region. Distribution of average heterozygosity values for 100,000 ~550 kbp regions of unique sequence randomly sampled with replacement from the autosomal genome compared to average heterozygosity values for the critical region (black line) and flanking unique sequences (colored lines). The critical region lies in the bottom 2.6% of the distribution, showing low diversity consistent with potential positive selection. Bottom schematic indicates locations of the critical region and flanking unique regions in relation to segmental duplications across the locus—note that BOLA2A is located at BP5 and BOLA2B at BP4. e) Low Tajima’s D score for the chromosome 16p11.2 BP4–BP5 critical region. Distribution of Tajima’s D scores for 2,987 non-overlapping ~550 kbp regions across the genome compared to Tajima’s D scores for the critical region (black line) and flanking unique sequences (colored lines). The critical region lies in the bottom 2.7% of the distribution, consistent with possible positive selection. The distribution is centered near −2 rather than 0 because most SNVs in the 1000 Genomes dataset are rare variants having arisen during the large expansions of human populations over the past 100,000 years. Bottom schematic indicates locations of the critical region and flanking unique regions in relation to segmental duplications across the locus.

