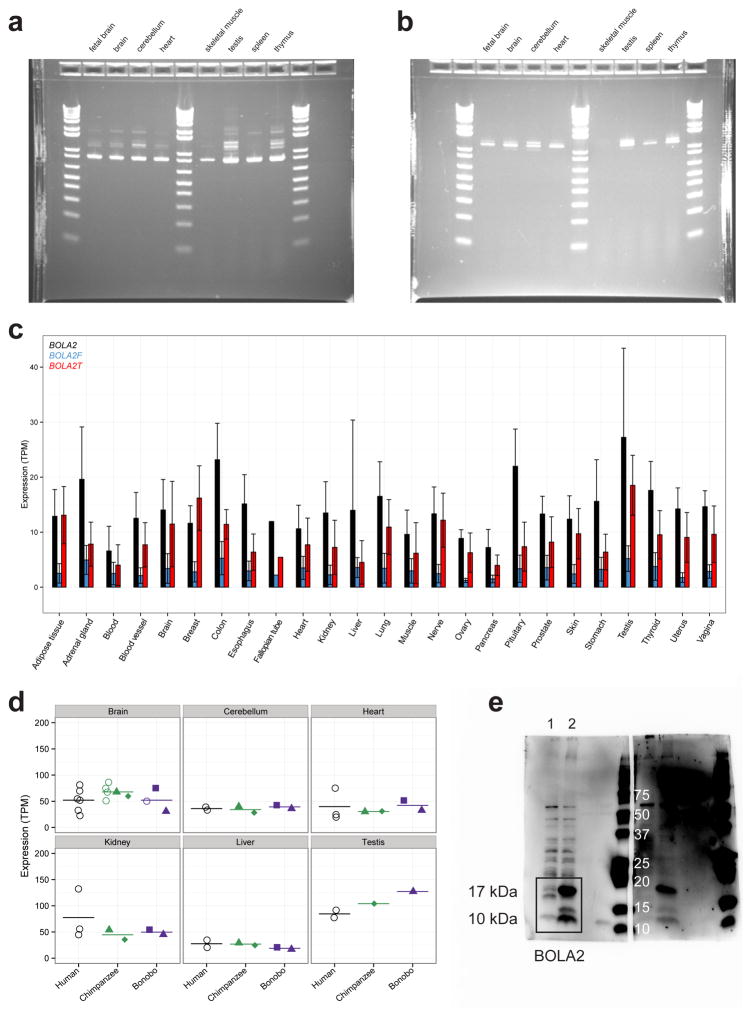
Extended Data Figure 9. BOLA2 expression and antibody validation.
a) RT-PCR expression profile for canonical BOLA2. The expected product size for canonical BOLA2 (838 bp) was observed in all eight human tissues. 1 kb + DNA ladder (Thermo Fisher). b) RT-PCR expression profile for BOLA2-SMG1 fusion product. The expected product size for the BOLA2 fusion transcript (1,239 bp) was observed as a doublet in all tissues except skeletal muscle. Intensity of upper band differs between tissues. 1 kb + DNA ladder (Thermo Fisher). c) BOLA2 RNA-seq expression analysis. Canonical (BOLA2) and fusion transcripts (BOLA2F, BOLA2T) were assessed across 25 humans from GTEx RNA-seq data. Bar heights indicate mean expression levels for each tissue in TPM with standard errors shown (error bars). Colors correspond to different BOLA2 isoforms as indicated. d) BOLA2 expression among primates in six adult tissues. Each point indicates a BOLA2 expression estimate from a single tissue sample, with samples obtained from a total of 18 humans, 6 chimpanzees, and 3 bonobos. Open circles correspond to individuals analyzed in a single experiment, while closed shapes denote data from multiple experiments involving the same individual, with each distinct color + shape pattern showing all experiments for a particular individual. Horizontal lines show mean expression values for each species and tissue. Combined with our expression analyses of iPSCs, these data show BOLA2 expression differs substantially between human, chimpanzee, and bonobo only in stem cells. e) Western blotting of HeLa cells transfected with the human BOLA2 annotated CDS and probed with an anti-BOLA2 antibody (Sc-163747). Whole-cell lysate of HeLa cells non-transfected with the overexpression construct (lane 1) and transfected with the human BOLA2 annotated CDS (lane 2) were probed with anti-BOLA2 antibody. Two bands with molecular weights of 10 and 17 kDa are identified and more abundant in transfected cells and correspond to two BOLA2 protein isoforms arising from different translation start sites.

