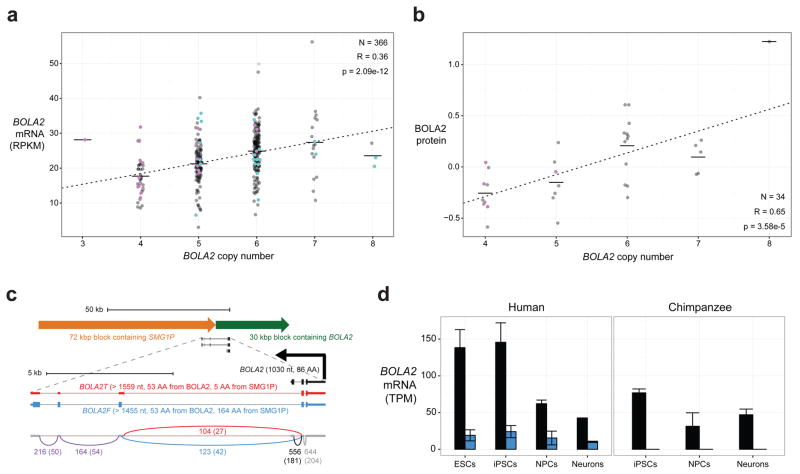
Figure 3. BOLA2 expression analyses.
a) Normalized BOLA2 mRNA expression quantifications20 in 366 LCLs from individuals genotyped for BOLA2 paralog-specific copy number. Points indicate expression levels and copy number (jittered) for each cell line, and horizontal lines show the mean expression level for each copy number. Line shows least squares regression. Point colors indicate BOLA2B copy number (pink = 1 copy, black = 2 copies, cyan = 3 copies). Groups with the same aggregate BOLA2 copy number but different combinations of paralog-specific copy number do not exhibit differential expression, consistent with both BOLA2A and BOLA2B producing mRNA. b) Plot layout is the same as in panel a, but data show BOLA2 protein expression quantified by Western blot densitometry on protein lysates from 34 LCLs. Though the sample size is small, no evidence indicates differential protein expression of distinct BOLA2 paralogs. c) BOLA2 gene models, predicted protein products, and support from RNA-seq data from human iPSCs. RT-PCR, cloning, and capillary sequencing experiments identified three BOLA2 isoforms: the canonical isoform (BOLA2, black) encoding an 86 residue protein and two fusion isoforms consisting of the first two exons from canonical BOLA2 fused with three exons from SMG1P. One of the fusion isoforms (BOLA2F, blue) maintains the BOLA2 ORF well beyond the fusion junction and is predicted to encode a 217 residue protein deriving primarily from SMG1P, whereas a third isoform (BOLA2T, red) contains a premature stop codon within the first SMG1P-derived exon. Numbers next to curved lines indicate mean counts of RNA-seq reads from two human iPSCs (two independent clones each) supporting each exon-exon junction, with standard errors in parentheses. d) RNA-seq quantification of BOLA2 mRNA expression through in vitro differentiation of primate iPSCs into neurons. Data from two human and two chimpanzee cell lines (two independent clones each, except for neurons) reveal significantly higher levels of BOLA2 transcripts in human iPSCs than in chimpanzee iPSCs and that BOLA2 RNA levels decrease through neuronal differentiation. Bar heights indicate mean expression levels for each species and differentiation stage in transcripts per million (TPM), with error bars showing standard errors. Bar colors correspond to different BOLA2 isoforms as in panel c. BOLA2 expression in human ESCs (two cell lines) is consistent with data from human iPSCs, suggesting the iPSC data accurately reflect BOLA2 expression at early stages in development.

