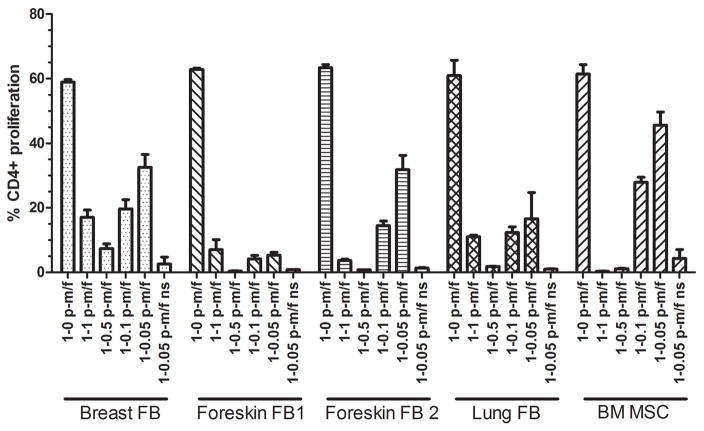
Figure 5. Fibroblasts suppress CD4+ T cell proliferation.
PBMCs from a healthy donor were stained with CFSE. Labled PBMCs were plated with four fibroblast strains (FB) or our standard BM MSCs (positive control) at different PBMC:MSC/FB ratios. After a 4-day co-culture, cells were collected, stained with anti-CD4, and analyzed by flow cytometry. A non-stimulated (ns) co-culture at 1-0.05 PBMC:MSC/FB ratio served as a negative control as well as to measure the level of stimulation induced by the strain itself. The value of p-m/f indicates the ratio of PBMCs to MSCs/fibroblasts. Bars represent means ±SE.

