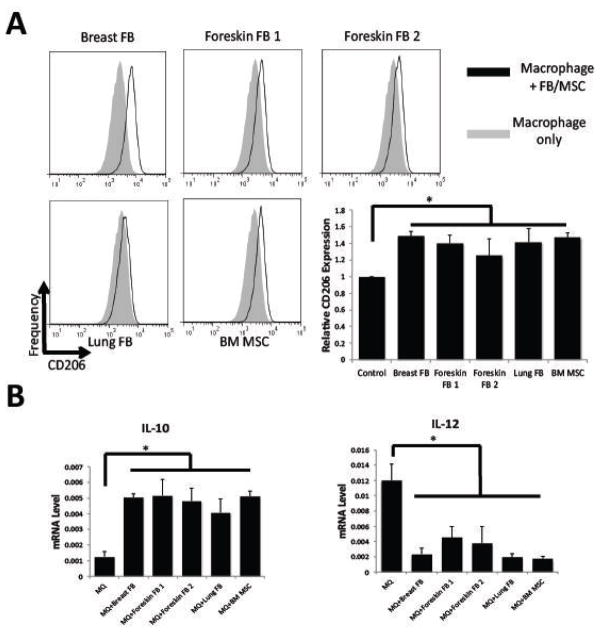
Figure 6. Immunophenotype of Fibroblast-educated macrophages.
CD14+ cells were isolated from peripheral blood of 3 different donors and plated in 6-well plates (1x10⁶/well) for 7 days to allow for differentiation into macrophages. Then fibroblasts or MSCs (2x10⁵/well) were added and co-cultured for 3 days. Macrophages were harvested by scraping the plates. Cells were stained with anti-CD14 and anti-CD206, and CD206 expression was analyzed in CD14-positive cells. Representative histograms are shown. The bar graph represents the average CD206 mean channel fluorescence in units relative to the control (no MSCs or fibroblasts added to CD14+ cells) ±SE from 3 independent experiments. (B) Q-PCR was used to assess gene expression of IL-10 and IL-12 normalized to 3 housekeeping genes (18S rRNA, GAPDH, and beta-actin). Relative mRNA levels (2^-ΔCt) are plotted. Samples were analyzed in triplicate, and bars represent means ±SE. *P<0.05 compared to control.

