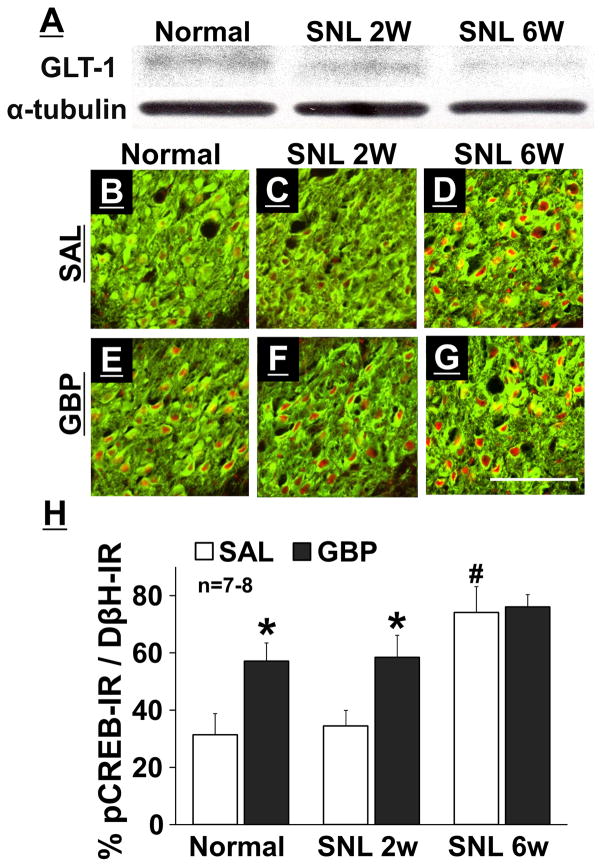
Figure 2.
(A) Representative Western blotting images of GLT-1 and α-tubulin in the right LC from normal, SNL 2W, and SNL 6W rats. (B–G) Photomicrographs and (H) quantification of DβH-IR (green) and pCREB-IR (red) in the right LC collected from normal, SNL 2W, and SNL 6W rats one hour after an intraperitoneal injection of saline (SAL) or gabapentin (GBP, 100 mg/kg). Scale bar = 100 μm. Data (mean + SD) are presented as the percentage of pCREB-IR in DβH-IR neurons. *P < 0.01 vs. saline. #P < 0.01 vs. normal and SNL 2W.

