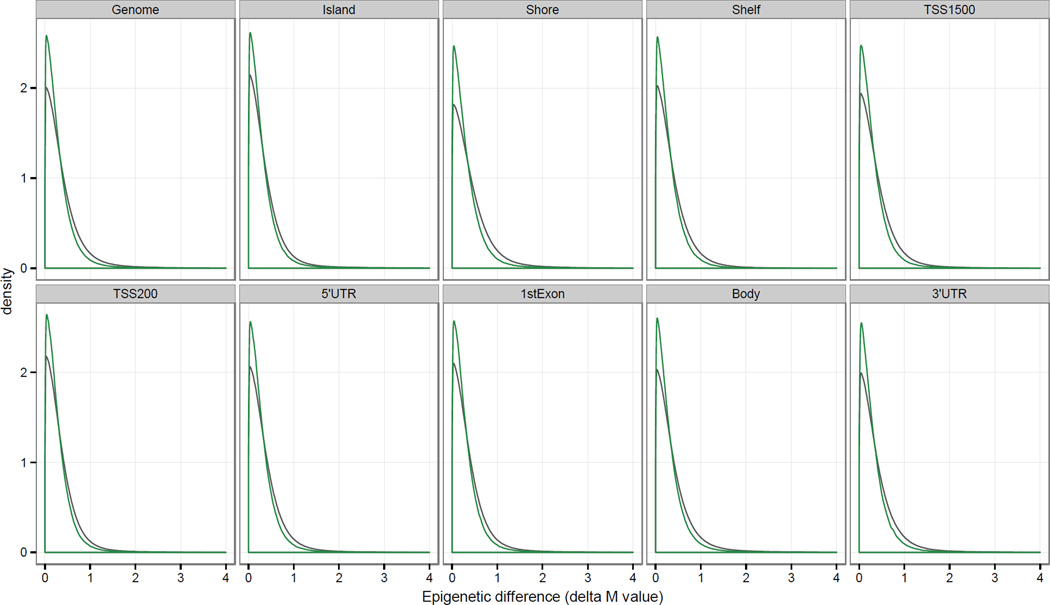
Figure 3.
Intra- and inter-patient distribution of pairwise sperm epigenetic differences (|ΔM-values|) across genomic regions. Normalized and logit-transformed methylation (M) values were used to plot the genome-wide density distribution of the intra- (green) and inter-patient (gray) |ΔM-values|. Intra-patient epigenetic differences were calculated using the 2 collected samples from the same individuals (n=12), while the inter-patient comparison measured the difference between all samples and all patients (n=264).

