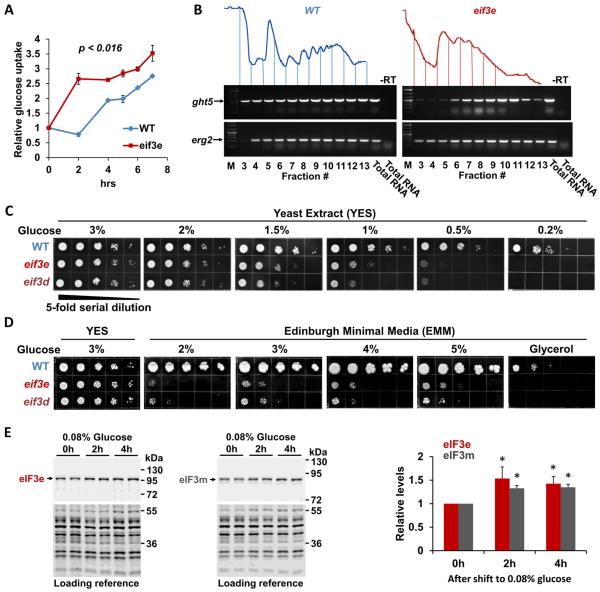
Figure 4. Effect of eIF3 deficiency on glucose uptake.
A) Glucose uptake was measured by determining the depletion of glucose from the media during the growth of wild-type (WT) and eif3e deleted cells using a YSI 2950 metabolite analyzer. Glucose concentration in the media was normalized to cell growth (i.e. OD600) to account for the slower growth rate of eif3e deleted cells. Data are averages of three biological replicates with error bars indicating standard deviations. Statistical significance was assessed with a t-test assuming two-tailed distribution and unequal variance.
B) RNA was purified from sucrose density gradient fractions prepared from WT and eif3e mutant cells and employed in RT-PCR reactions with primers specifically amplifying the mRNA encoding the hexose transporter ght5 and erg2 as a reference. Only fractions containing mRNA (3 – 12) were used for RT-PCR. Total RNA was used as reference. Reactions excluding reverse transcriptase are shown to prove that the band shown is derived from RNA not DNA.
C) Growth of eif3e and eif3d deleted cells under limiting glucose conditions. 5-fold serial dilutions of the indicated strains were plated onto rich yeast extract (YES) media containing decreasing glucose concentrations and growth was scored after 2 – 4 days.
D) Growth of eif3e and eif3d deleted cells on minimal media (EMM) containing increasing concentrations of glucose or on glycerol as the sole carbon source.
E) Effect of glucose restriction on the levels of eIF3e and eIF3m proteins. Strains harboring alleles of eif3e and eif3m modified with protein A epitope tags (Zhou et al., 2005) were shifted from media containing 3% glucose to medium containing 0.08% glucose for the indicated times. Cell lysates were loaded in duplicates and blotted with anti-protein A antibodies to detect eIF3e and eIF3m, respectively. Bands obtained with anti-PSTAIR antibodies were used as loading reference (bottom panels). Blots from biological replicates were quantified with the Licor Image Studio Lite package and results corrected for the loading reference were plotted. Statistical significance was assessed with a t-test assuming two-tailed distribution and unequal variance. Asterisks indicate p < 0.05.

