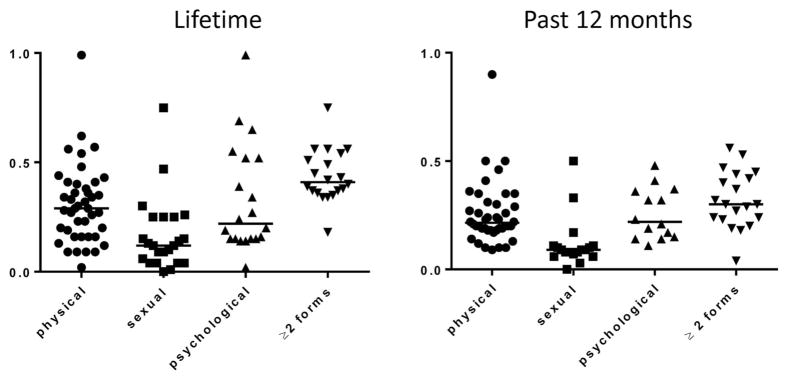
Figure 3.
A summary of the lifetime and past 12-month prevalence estimates of the various forms of DV as documented by each individual study.
Note: Circles, squares, upright triangles, and inverted triangles represent prevalence estimates of psychological, physical, sexual, and multiple forms of DV, respectively, as provided by each individual study. While medians and ranges are provided, further analysis was not carried out due to the limited homogeneity between studies impeding accurate comparison.

