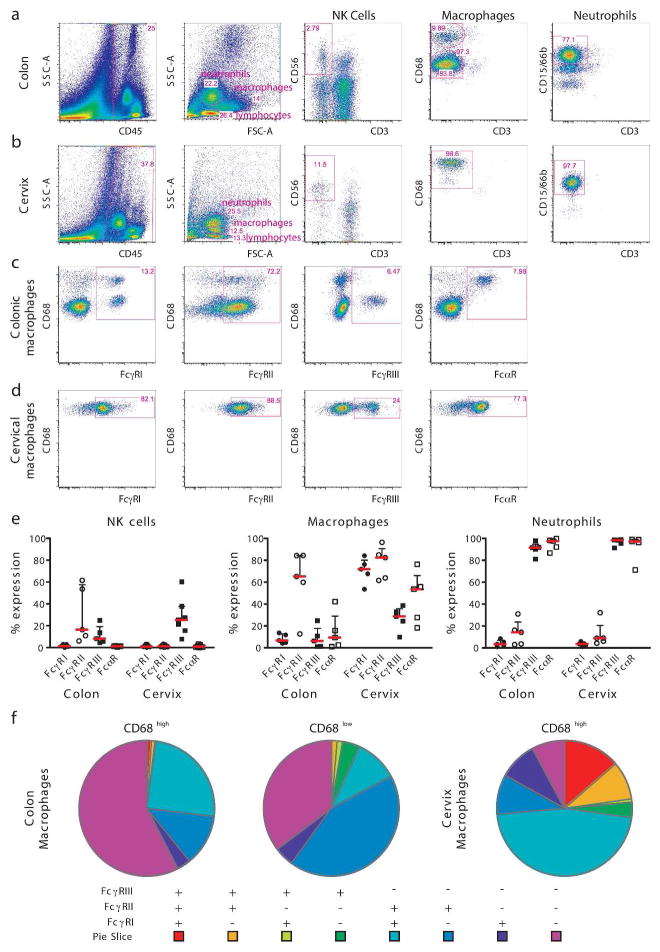
Figure 2. FcR expression profile on colonic and cervical innate immune cells.
Gating strategy for NK cells, macrophages and neutrophils is depicted in (a) for colon and (b) for cervix and a representative flow plot for each FcR is presented on colonic (c) and cervical (d) macrophages. Percent of FcR expression on NK cells, macrophages and neutrophils (e) in colon and cervix. The pie charts depict the co-expression profile of all Fcγ receptors in colonic CD68high and CD68low and cervical CD68high macrophages (f).

