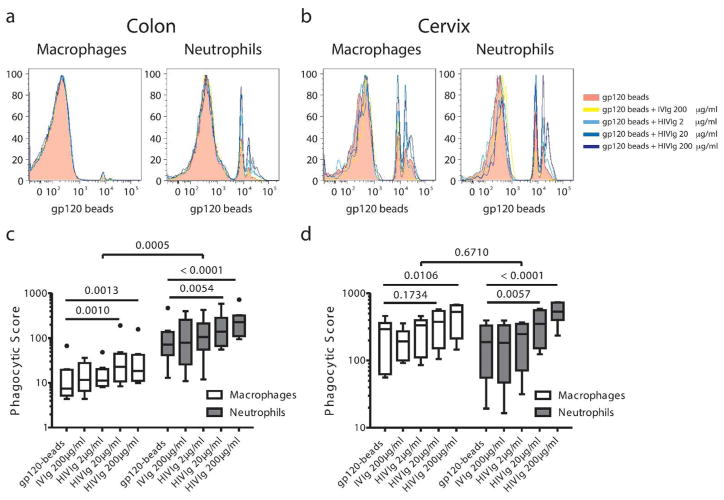
Figure 3. Phagocytic activity profiles in colon and cervix.
Representative histograms of phagocytic activity of macrophages and neutrophils to gp120-coated beads and gp120-directed immune complexes in colon (a) and cervix (b). Phagocytic activity is represented as a phagocytic score =% of cells taking-up beads x MFI/1000 in colon (c) and cervix (d). Colon, N=8; cervix, N=6.

