
Fig. 3.
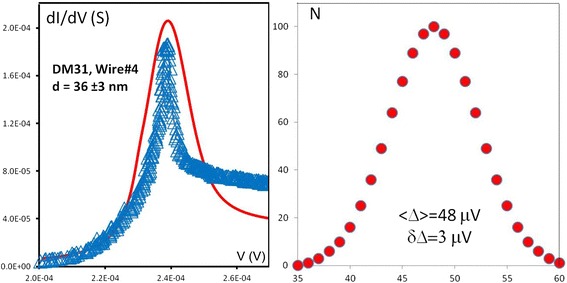
a Experimental (symbols) and simulated (line) for a typical gap-edge singularity eV = Δ1(Al) + Δ2(Ti). b Distribution of the titanium gap fluctuations used in fitting data from panel a: , δ|Δ 2| = 3 μeV
Official websites use .gov
A
.gov website belongs to an official
government organization in the United States.
Secure .gov websites use HTTPS
A lock (
) or https:// means you've safely
connected to the .gov website. Share sensitive
information only on official, secure websites.
a Experimental (symbols) and simulated (line) for a typical gap-edge singularity eV = Δ1(Al) + Δ2(Ti). b Distribution of the titanium gap fluctuations used in fitting data from panel a: , δ|Δ 2| = 3 μeV