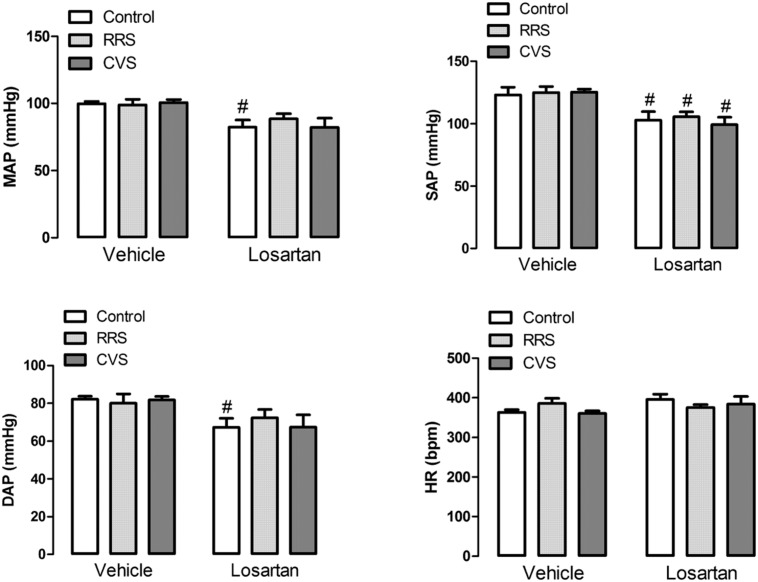
FIGURE 2.
Mean (MAP), systolic (SAP), and diastolic (DAP) arterial pressure; and heart rate (HR) in animals treated with vehicle or losartan control (white bars) and subjected to RRS (light gray bars) or CVS (dark gray bars). The bars represent the mean ± SEM. #p < 0.05 versus respective vehicle group. Two-way ANOVA followed by Bonferroni post hoc test. (control vehicle: n = 6, control losartan: n = 8, RRS vehicle: n = 8, RRS losartan: n = 8, CVS vehicle: n = 8, CVS losartan: n = 7).

