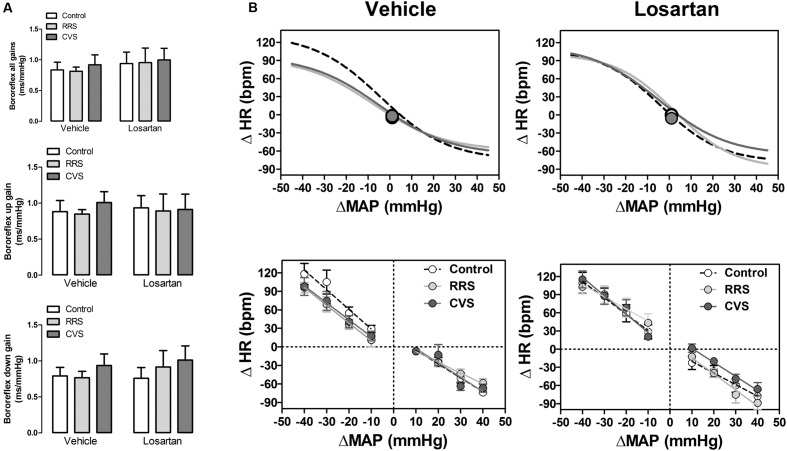
FIGURE 4.
Baroreflex activity in animals treated with vehicle or losartan control (white symbols) and subjected to RRS (light gray symbols) or CVS (dark gray symbols). (A) Spontaneous baroreflex sensitivity (SBS) determined by the sequence analysis technique. Graphs present the mean of all slopes (baroreflex all gains, up and down sequence slopes; top) and the slopes of up (baroreflex up gain, middle) and down (baroreflex down gain, bottom) sequences. The bars represent the mean ± SEM. (control vehicle: n = 6, control losartan: n = 8, RRS vehicle: n = 8, RRS losartan: n = 8, CVS vehicle: n = 8, CVS losartan: n = 7). Two-way ANOVA followed by Bonferroni post hoc test. (B) Non-linear (top) and linear (bottom) regression analysis of the baroreflex correlating mean arterial pressure change (ΔMAP) evoked by intravenous infusion of phenylephrine and SNP and the reflex HR response (ΔHR). Symbols on sigmoid curves indicate the median blood pressure (BP50). (control vehicle: n = 6, control losartan: n = 8, RRS vehicle: n = 8, RRS losartan: n = 8, CVS vehicle: n = 8, CVS losartan: n = 7).

