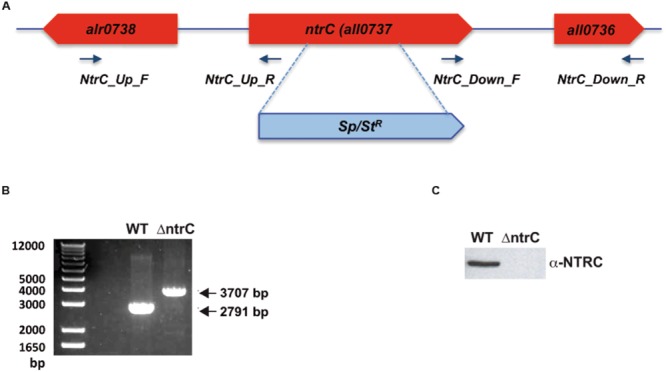
FIGURE 1.

ΔntrC mutant construction. (A) ntrC locus representation, where the ntrC gene disruption and the spectinomycin marker gene insertion are depicted. The location of the primers used for the mutagenesis is also shown. (B) Confirmation of the mutant by PCR. The amplification of the WT sequence was 2791 bp, meanwhile the sequence after insertion was 3707 bp long. (C) Western blot showing the absence of AnNTRC in the mutant.
