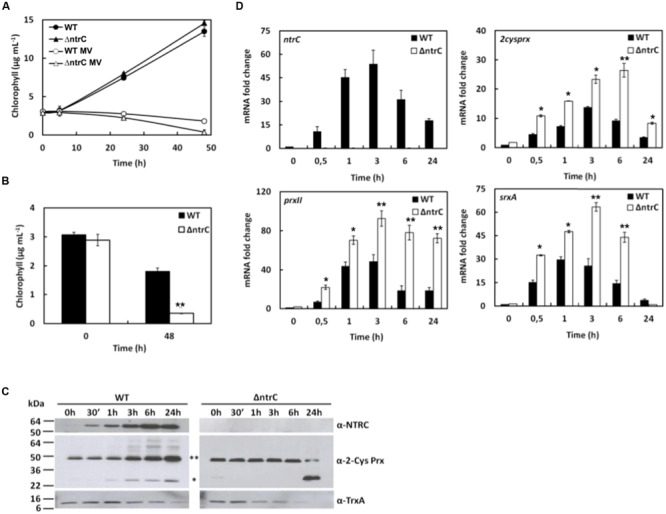
FIGURE 4.

Anabaena ΔntrC mutant sensitivity to MV treatment. (A) Growth of WT and ΔntrC strains after MV addition. (B) Histogram representation of chlorophyll content at 0 h and 48 h of growing of WT and ΔntrC strains under 0.5 μM MV treatment. (C) Western blot analysis of AnNTRC and 2-Cys Prx levels in response to MV. TrxA was used as loading control. ∗∗ Dimer. ∗ Monomer. (D) Quantification of relative mRNA levels of ntrC, 2cysprx, prxII and srxA and in response to MV addition. Error bars show SE (n = 3). Asterisks indicate significant differences (∗P < 0.05 and ∗∗P < 0.01) compared with the corresponding wild type.
