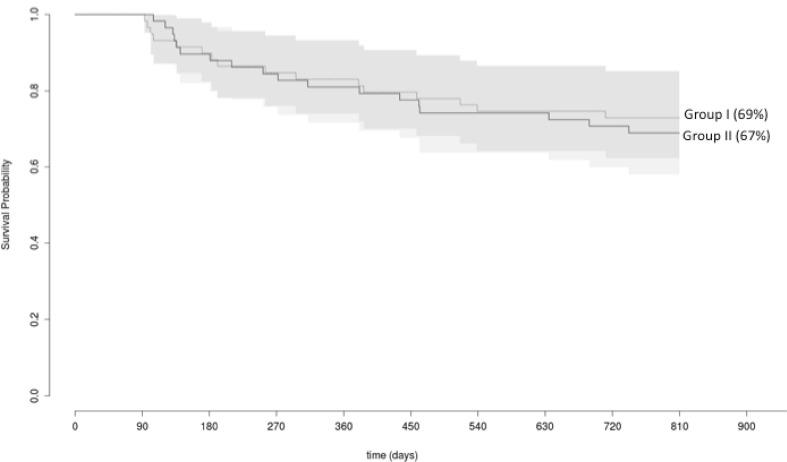
Fig. 2.
The Kaplan–Meier curve demonstrates the relative proportion of patients in stable sinus rhythm following index pulmonary vein isolation using the second-generation 28 mm cryoballoon during a follow-up period of 849 ± 74 (group 1) and 848 ± 101 days (group 2, p = 0.13). 69 % of patients (group 1) and 67 % of patients (group 2) remained in stable sinus rhythm during the follow-up period (p = 0.69)

