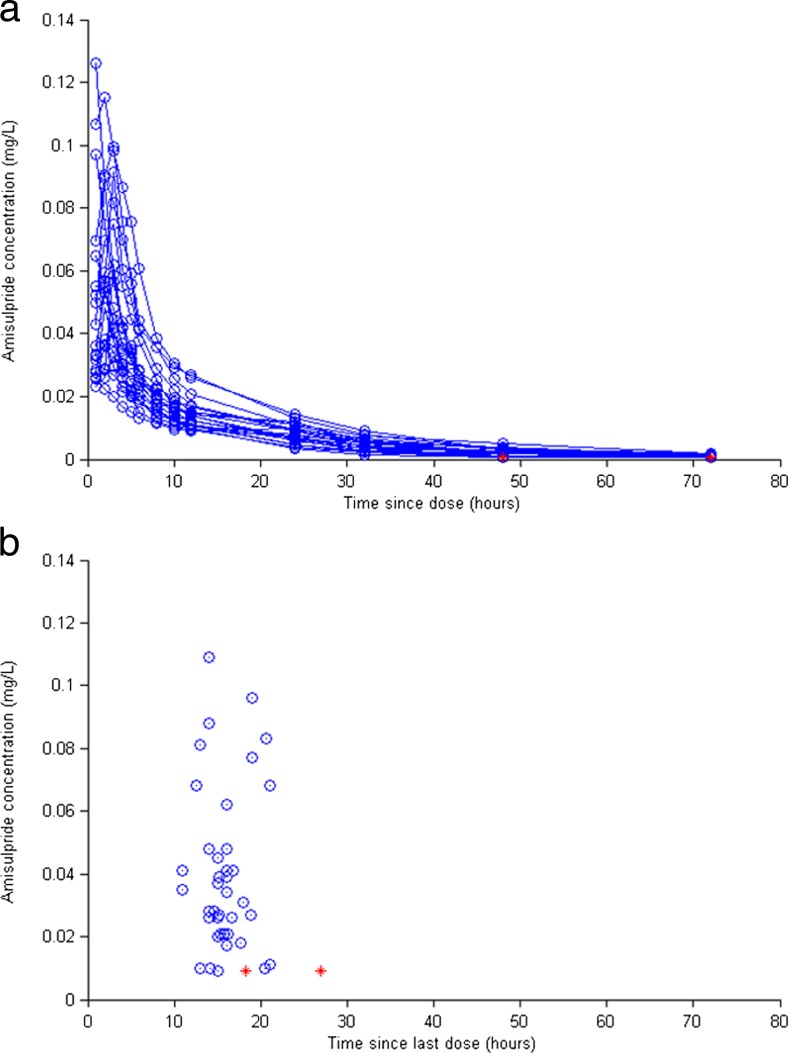
Fig. 1.
Scatterplot showing time since dose versus observed amisulpride concentration (mg/l) in group 1, following a single 50-mg oral dose (a), and group 2, at steady state across a dose range of 25–75 mg daily (b). Concentrations below the limit of the assay sensitivity are shown in red (colour figure online)

