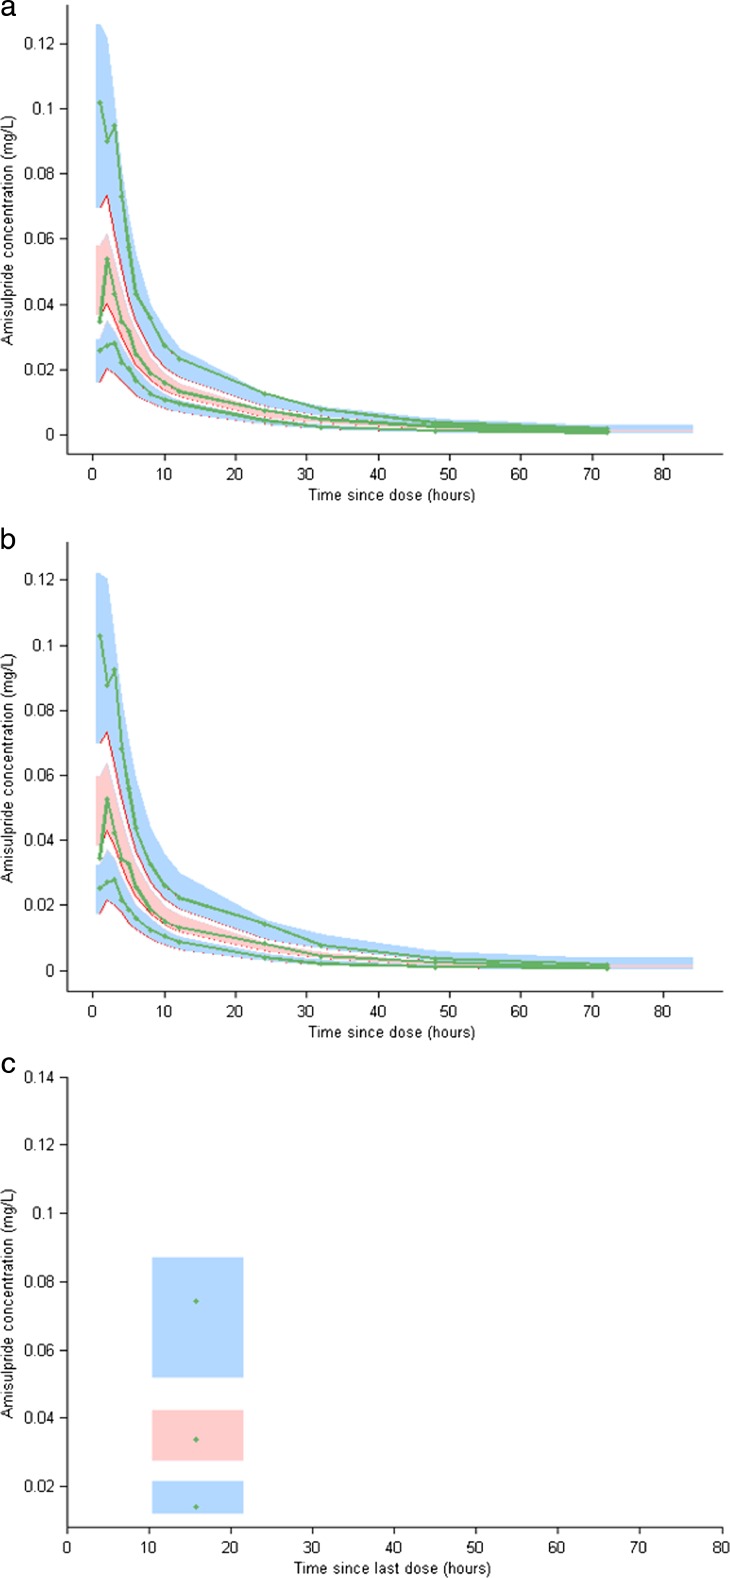
Fig. 2.
Visual predictive checks (VPC): 95 % prediction intervals around the 5th, 50th and 95th percentiles are shown for the final model after analysis of group 1 data alone, overlaid to group 1 observed 5th, 50th and 95th percentiles (a), and after analysis of the combined dataset overlaid to group 1 observed 5th, 50th and 95th percentiles (b), and overlaid to group 2 observed 5th, 50th and 95th percentiles (c)

