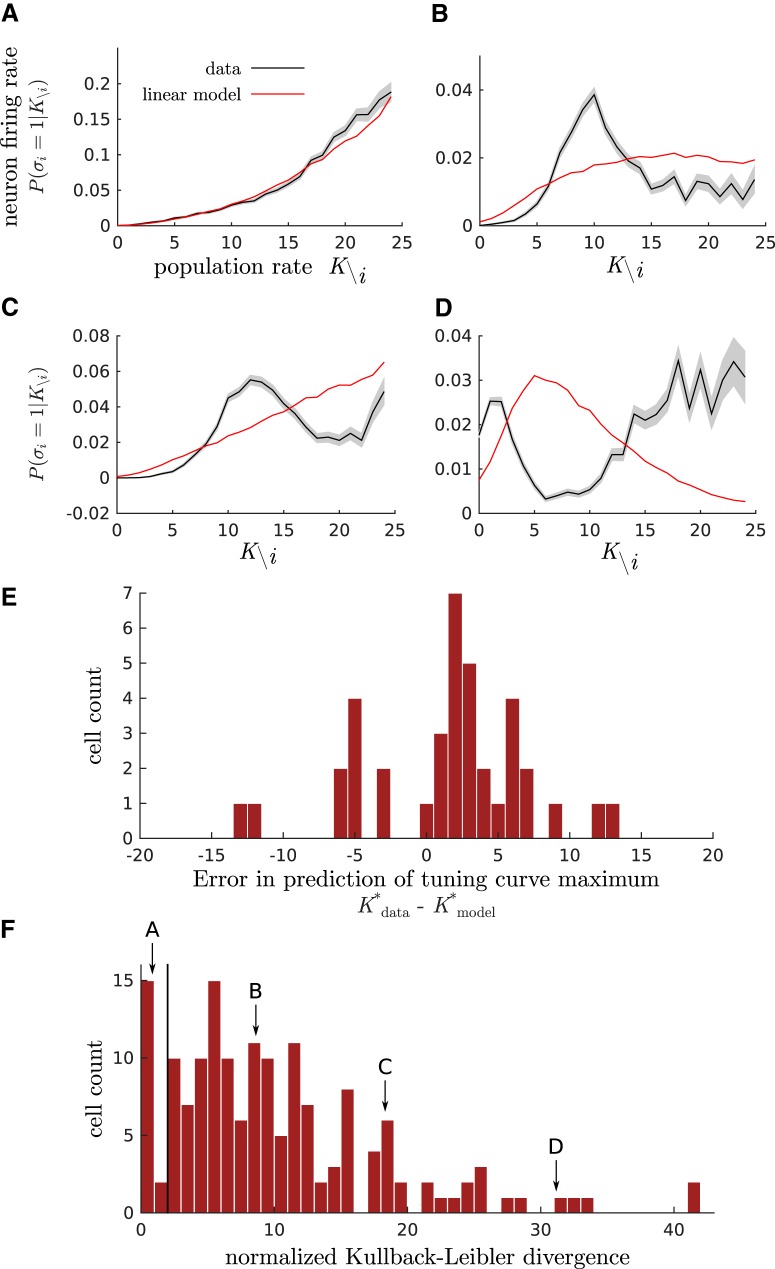
Figure 2.
Tuning curves of single neurons as a function of the population rate. A–D, Spiking probability of neuron i conditioned on the summed activity of all other neurons , as observed in the data (black curves; SE is shaded in gray) and predicted by linear-coupling model (red curves). Each subfigure corresponds to a different representative cell. E, Histogram of the difference between the preferred population rate—at which the tuning curve is maximal—observed in the data, , and predicted by the linear-coupling model, . Data are shown for the 38 cells that had at least one local maximum both in the linear model and in the data. When the empirical tuning curve had two local maxima, the closest one to the model prediction was chosen. F, Histogram of the normalized KL divergence between the observed joint distributions and its prediction by linear-coupling model. The arrows indicate the value for the four example cells A–D. The vertical line shows a normalized divergence of 2, meaning that cells sitting on its right deviate from the linear-coupling model by >2 SDs.

